Pullbacks happen all the time, and knowing how to apply useful pullback trading strategies can bring you big benefits.
Table of Contents
1. Pullback Trading
A pullback is a short-term, temporary pause or moderate drop in the direction of the current bullish or bearish trend. This phrase is commonly used to describe price changes in the opposite direction that last only a few consecutive sessions before going back to the original trend.
Read more: Pullback: How To Trade And Profit With Pullback?
A common trading strategy is to take advantage of market pullbacks. The correction phases include waves that move against the prevailing trend. In order to time trade entries during these phases, traders watch for these correction phases when trading pullbacks.
2. How To Trade Pullbacks?
The following is an in-depth guide that will walk you through the process of pullback trading:
Step 1: Identify the prevailing trend
You’ll first need to establish the overall trend of the stock, forex pair, or commodity you’re looking to trade. This can be determined through trend lines or moving averages.
For example, if a stock’s price is above its 200-day moving average, it’s typically in an uptrend. The opposite is true for a downtrend.
A pullback in an uptrend is a small price decline, whereas a pullback in a downtrend is a small price increase.
Step 2: Determine your entry point
Now you’ll need to establish when to enter your trade. This is typically when the price starts to revert back to its original trend following the pullback. By following these steps, you can increase your chances of success in pullback trading in both uptrends and downtrends.
Use Candlestick Pattern as an Entry Trigger
The first method I’d like to discuss is using patterns to increase the number of entry confirmations. You can use “pattern” to enter a trade once all of your other criteria have been met.
For example, you can enter long when you see a bullish reversal candlestick pattern, such as a Hammer, Bullish Engulfing, etc.
Learn more about the Candlestick patterns: Candlestick Patterns Basic But Useful Understanding For Beginner
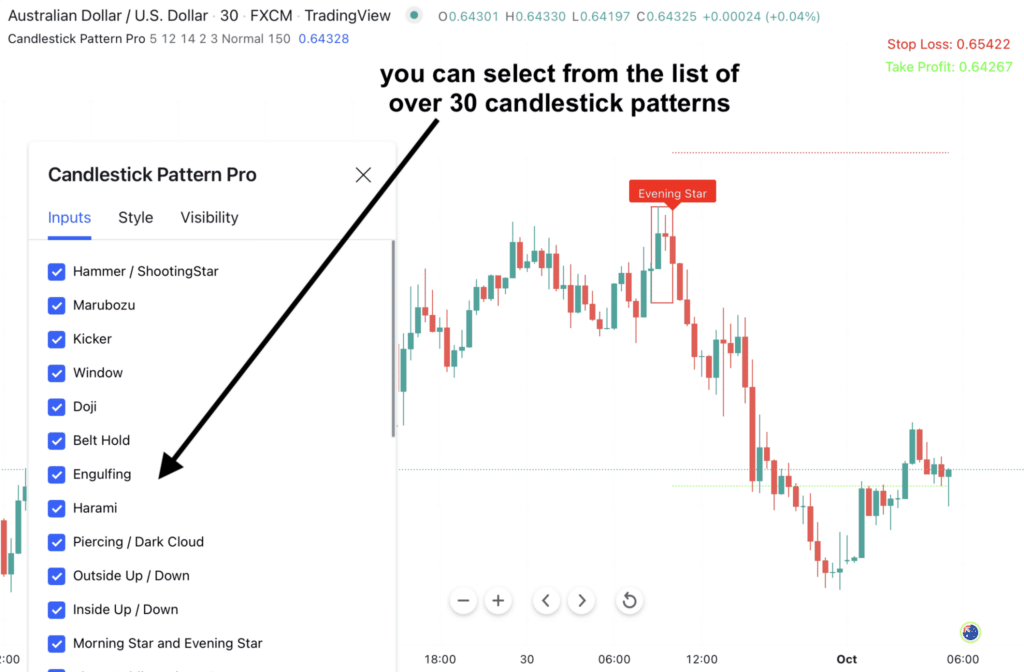
Pullback trading can benefit greatly from technical indicators that can recognize candlestick patterns on the chart, as these patterns can be used to target an entry.
Candlestick Pattern Pro is a fantastic TradingView indicator that can recognize 30+ candlestick patterns across all instruments and timeframes.
Pullback Entry Timing
To enter a trade, you can either watch for the price to return to the pullback area, or you can wait until the price returns back to the trend and reaches a new low.
The former strategy is considered riskier since you enter a trade against the price direction, and the price could easily go against you much further. This strategy has the potential for the highest reward-to-risk ratio due to the precision with which the stop loss can be set.
In the latter case, you simply follow the trend. Since the entry time is delayed, the potential payoff is reduced along with the risk.
Use the end of a pullback
The end of a pullback is often a favored entry point for many traders as it potentially signifies a return to the prevailing trend, whether that’s bullish or bearish. This strategy assumes that the price of an asset will continue in the direction of the overall trend once the pullback has concluded.
The crucial part is to confirm that the pullback has ended and the price is likely to resume its previous trend. There are several ways to do this. Technical analysis tools like Fibonacci retracements, moving averages, or trendlines can be used to gauge potential end points of pullbacks. Unfortunately, these indicators are not purposely designed to detect the end of a pullback, so you have to figure it out yourself.
The Pullback Factor indicator for TradingView might be a solution to that problem. Using an exclusive volatility-based algorithm, the pullback Factor indicator can predict with high accuracy when a pullback is going to end.
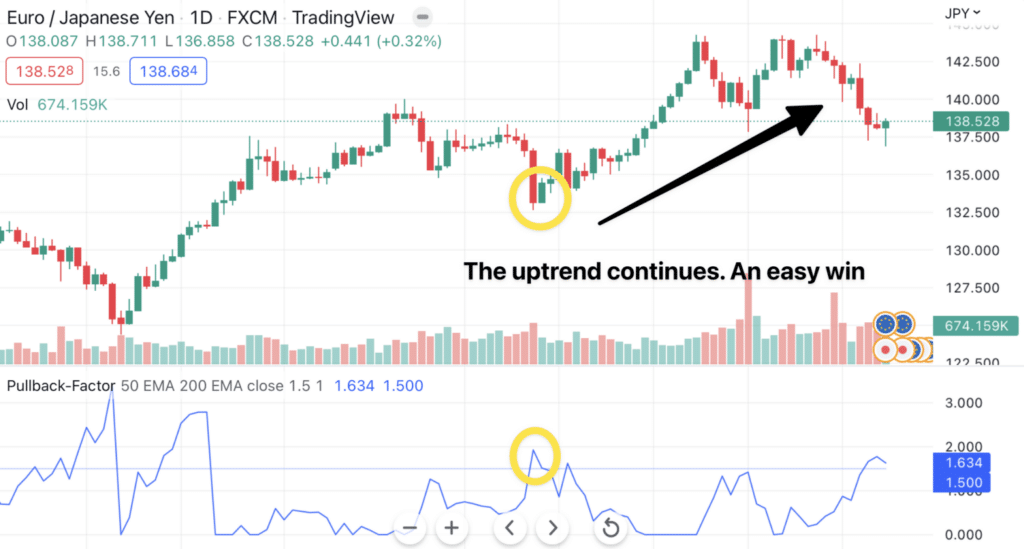
Here’s how you can work with it:
- The indicator provides you with a panel that shows you the Pullback Factor value throughout time.
- Every time the value is larger than 1.5, it means that there’s a great probability that this pullback is coming to an end.
- Enter right where the value is larger than 1.5 with great certainty of winning.
- You can also use this indicator in conjunction with the Moving Averages to filter out ideal trades.
After you have confirmation that the pullback has likely ended, this is your potential entry point. If the overall trend was bullish, you would enter a long position (buy). If it was bearish, you would enter a short position (sell).
Step 3: Set your stop loss and take profit levels
You should manage your risk as you would with any trading strategy. A stop loss order can be placed just below the lowest point of the pullback in an uptrend or above the highest point of the pullback in a downtrend. This will limit your losses in case the price does not revert to its original trend.
Your take profit level, on the other hand, should be set at a point where you’ll be satisfied with your profit. This might be just before a strong resistance level in an uptrend or a strong support level in a downtrend.
Read more: 5 PULLBACK TRADING STRATEGIES AND HOW TO TRADE PULLBACKS
3. The Bottom Line
Remember that while pullback trading can be profitable, it also involves risk. The pullback could turn out to be a trend reversal, and the price could move against you.
Using technical indicators like the Candlestick Pattern Pro or Pullback Factor can provide valuable insights into market trends and help you make informed trading decisions.