Bullish and bearish trend conditions are the foundation of most successful trading strategies. ‘Stick with the trend, avoid the stress’ – a popular mantra among retail traders, young and old. It’s the safest and most recommended approach by any standards. However, the big question on every newbie’s mind is how to foresee the end of a bullish and bearish trend before the market reverses.
This concise article shares more insights into the tell-tale signs of a weakening trend while understanding the characteristics of strong bullish or bearish ones. As a bonus, readers will gain exclusive access to a groundbreaking innovation that improves trading results dramatically.
Table of Contents
1. Understanding Bullish and Bearish Trending Conditions
Trends in the financial market refer to periods of a one-sided market movement.
A series of green or red candles appear on candlestick charts to indicate their presence.
Hence, these environments are the best for trading because there is little to no resistance to price moves.
Provided no significant technical or fundamental event, optimists expect the run to continue for as long as possible.
Conventionally, trending conditions can be bullish or bearish depending on the market’s direction.
1.1 Bullish Trends
Bullish trends (also called uptrends) are characterized by high-momentum movement upwards. The market continuously hits higher prices for a considerable period.

As long as the uptrend momentum lasts, the market will violate every noteworthy resistance level. They can range from old highs to Fibonacci points, liquidity voids, order blocks, etc.
Technical analysts use several methods to spot and confirm bullish trends, including trendlines and chart pattern studies.
While some expect the candlesticks to trade above Moving Averages consistently, others prefer confirmations from a MACD crossover to be confident.
1.2 Bearish Trends
Bearish trends, on the other hand, signify periods of uninterrupted price falls. Thus, traders also call them downtrends.
In the forex, stocks, or commodity market, it denotes the relative devaluing of a currency (like Euros), company stock (like Apple’s), or commodity (like gold), respectively.
Below is a sample scenario of a bearish condition:
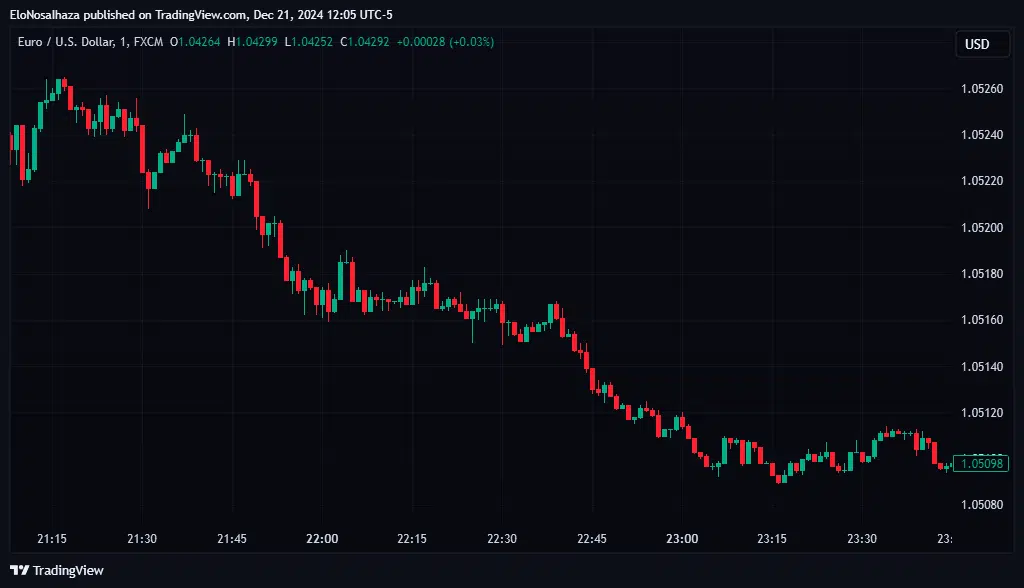
Every support level in the form of Fibonacci retracements, pivot points, old swing lows, and volume clusters gives way to the bearish fall.
Downtrends can be the result of several factors, including economic decline and increasing interest rates. They lead to rising corporate profits and expense to borrow, causing stock prices to fall.
Changed policies, new government, elections, and low investor confidence are other reasons for bearishness.
2. How To Discover a Weakening Trend in 5 Ways
A market consolidates when its price is not moving up or down (bullish or bearish) for a sustained period with momentum.
Pros advise against trading during such times because of the degree of uncertainty.
However, forecasting such periods may be challenging, especially when the market is trending.
The following are some helpful methods to consider individually or combined:
2.1 Volume Analysis
An uptrend with increasing volume signifies more participation unlike, a diminishing volume. The latter denotes a weakening trend because fewer market participants support the move.
Interested traders should think more meticulously during such periods, strengthen their risk management approach, and be less rigid with ideas and executions.
2.2 Price and Chart Pattern Signals
Classical technical analysis involves pattern studies, candlestick- and chart-wise. Some of these shapes signify a trend reversal.
Double tops, double bottoms, head and shoulders, and wedges are a few examples.
Whenever spotted, chart analysts brace themselves for a possible trend climax and the beginning of a new one.
2.3 Price Action Studies
During downtrends, the market continually violates swing lows, forming lower highs. When bullish, it moves beyond old highs and produces higher lows.
A simple and invaluable way to note a weakening trend is when the opposite happens.
For example, lower highs at any point during bullish conditions indicate a weakening trend.
2.4 Indicator Signals
Many indicators have unique methods to differentiate a fading trend from a strong one.
For example, a cross between two moving averages of different periods sparks suspicion among traders.
The trend may also be losing momentum when the Relative Strength Index (RSI) moves out of overbought/oversold zones.
The Average True Range (ATR) and Moving Average Convergence Divergence (MACD) are also convenient.
2.5 Broken Trendline
Another strategy to efficiently uncover the possible end of a bullish or bearish trend lies in the trendlines they maintain.
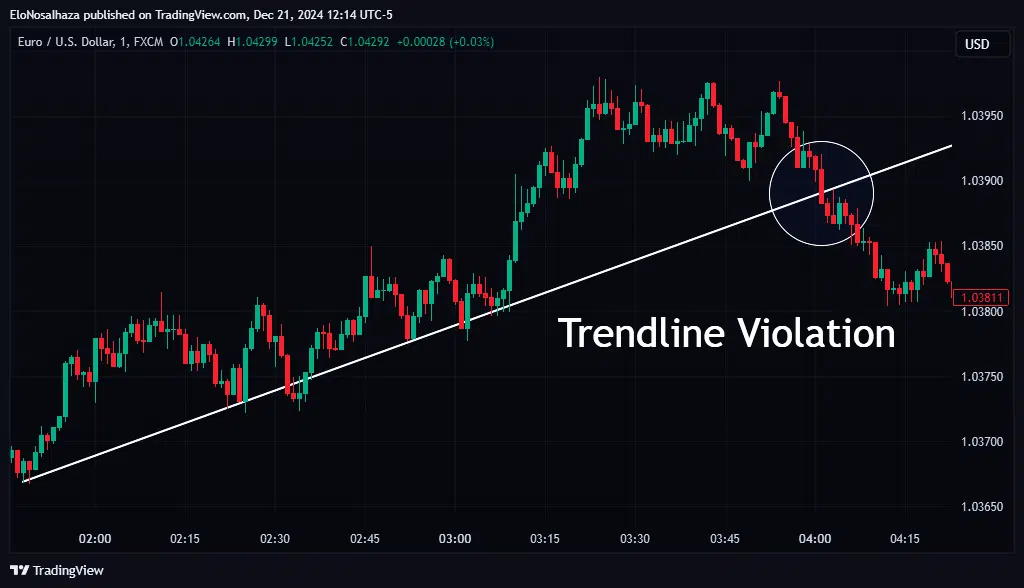
The trend may be losing momentum when the market moves beyond a trendline/channel it has maintained for a notable period.
3. Reaching New Heights With the Better Trend Trading for TradingView
Uncovering a promising trend in the charts is one thing; utilizing a signal is another. Typically, the latter is much more challenging than the former.
Therefore, every trader needs to harness the power of Indicator Vault’s powerful invention – Better Trend Trading.
It is a TradingView indicator designed to identify opportunities with the best profit potential in a trend.
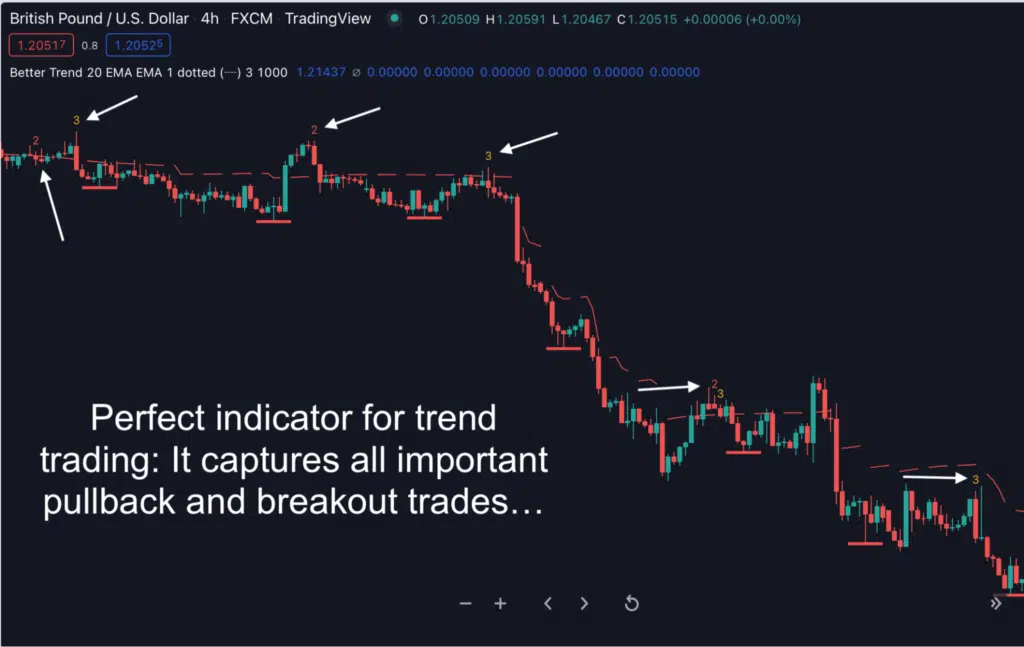
In short, below are a few benefits it offers:
- Knowledge of the outset of a new trend in both market directions
- Awareness of a potentially profitable pullback along the bullish or bearish trend
- Understanding of when and where breakouts occur
- Opportunity to always take a trade during trending conditions
- Liberty to explore different financial markets and asset classes
Sounds surreal? Click here to discover how real this opportunity is today!
4. Conclusion
Retail traders always understandably seek trends because they are the safest periods to make profits. There is always optimism, provided the market maintains its momentum.
However, the trend will end at some point, and the following methods discussed in this article can help any trader foresee it:
- Volume analysis
- Price and chart pattern signals
- Price action studies
- Indicator signals
- Broken trendline
The best companion for any trend trader is the Better Trend Trading for TradingView. It reveals the best setups, from pullbacks to breakouts, and allows exploration in other financial markets.
Please share this article with other trading enthusiasts and leave an opinion for engaging debates below.