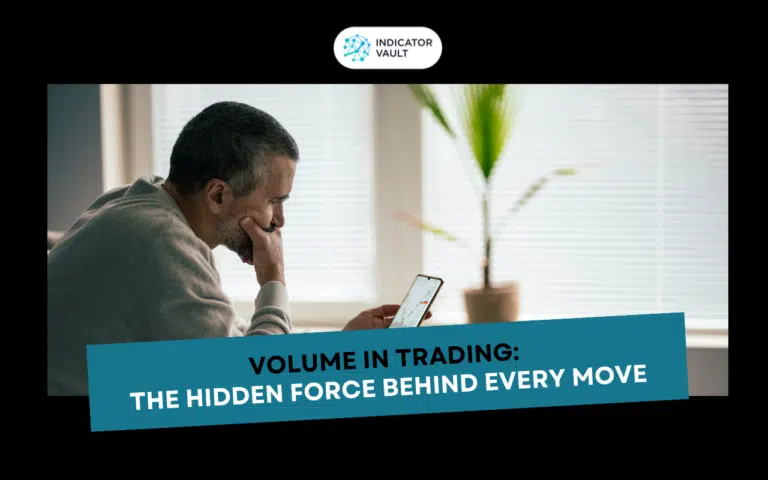
Volume in Trading: The Hidden Force Behind Every Move
Volume in trading reveals the real strength behind price moves. Learn what volume is, how to use it in your strategy, and how the Volume Force Pro indicator helps predict trend changes, market tops, and bottoms with precision. Table of Contents 1. What is volume? When most traders stare at charts, they only see prices….