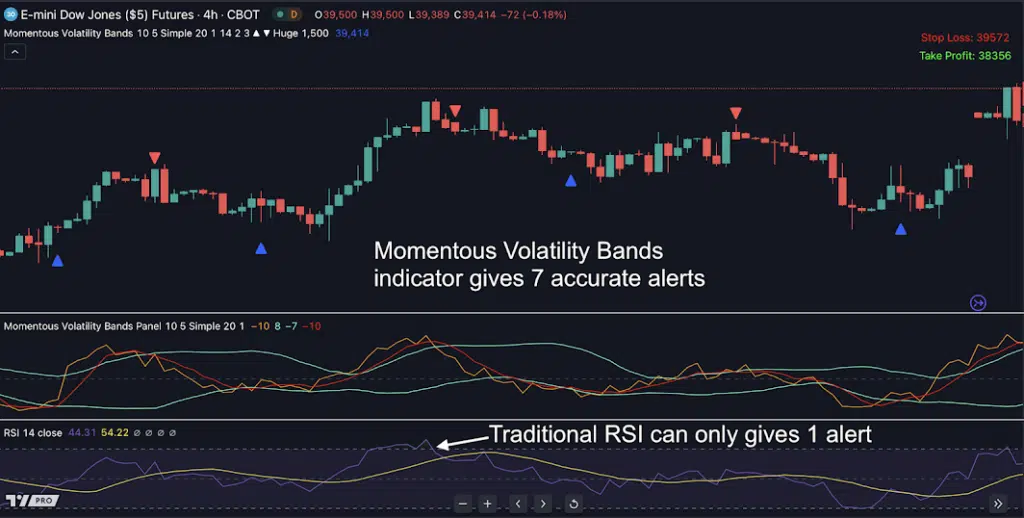
Tired of conflicting signals from Bollinger Bands and RSI? The Momentous Volatility Bands indicator solves this by transforming both indicators’ logic into a single, validated signal that helps you trade with clarity and precision.
In trading, momentum is the speed and strength of a price move. It tells you if a trend is gaining power or running out of steam.
Volatility is how much a price moves up and down. It helps you see when a market is stretched and a price reversal might be about to happen.
These two forces are exactly what traders try to measure when using Bollinger Bands and RSI together.
RSI measures momentum, showing whether buying or selling pressure is strengthening or weakening. While Bollinger Bands measure volatility by showing how far price has expanded away from its average.
When traders combine Bollinger Bands and RSI, they are effectively combining momentum and volatility into one clearer market reading.
Most traders apply Bollinger Bands and RSI separately. RSI shows overbought or oversold conditions, while Bollinger Bands measure price expansion and contraction.
The problem? Signals often conflict.
When both indicators are analyzed together, you gain confirmation. If price is overextended on Bollinger Bands and RSI shows exhaustion, that alignment creates stronger trade conviction.
Instead of reacting to isolated signals, combining Bollinger Bands and RSI gives you context: momentum strength plus volatility positioning.
That’s when entries become strategic instead of emotional.
While a single indicator might be good for one specific strategy, relying on it alone can lead to mistakes. A momentum tool might get “stuck” in a strong trend, and a volatility tool might give false signals during quiet markets.
This is why traders frequently combine Bollinger Bands and RSI to validate signals.
However, manually reading both tools side by side can still create hesitation. You may question which one to prioritize when signals diverge.
That’s where structured integration becomes powerful.
The Momentous Volatility Bands indicator simplifies the logic behind Bollinger Bands and RSI.
Instead of analyzing two separate panels, it unifies the principles of both into one streamlined view.
It merges the volatility logic behind Bollinger Bands with the momentum insight normally derived from RSI.
It combines momentum measurement with volatility expansion to help you trade day trading, swing trading, or scalping setups with greater clarity.
Momentous Volatility Bands indicator builds upon the core mechanics traders expect from Bollinger Bands and RSI but removes their conflicting noise.
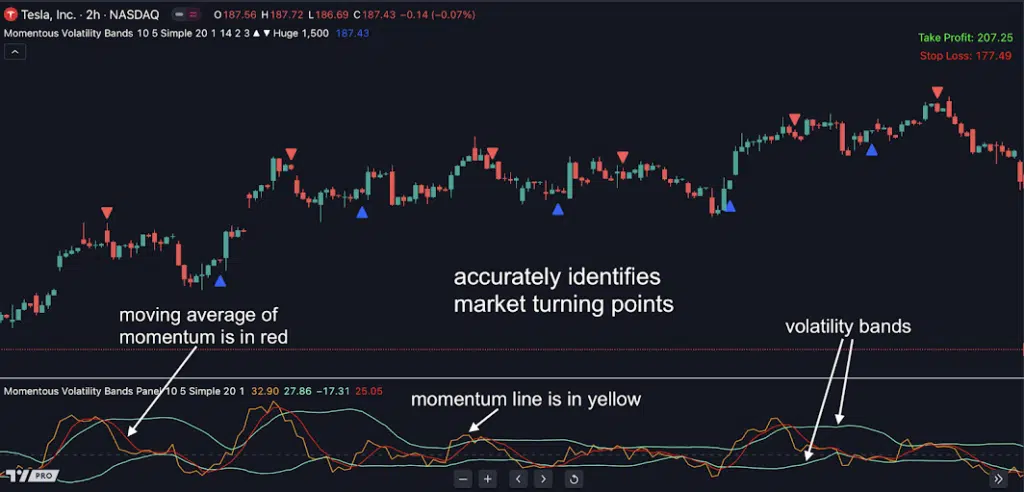
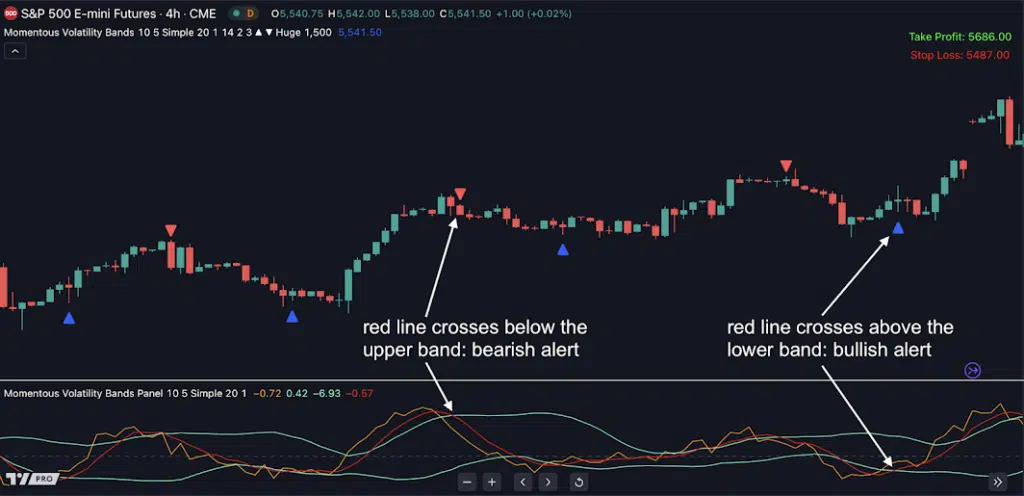
Here’s how it works:
Here’s just a taste of all the amazing features Momentum Volatility Bands gives you:
👉 See positive/negative momentum instantly
👉 Spot sharp price surges early
👉 Measure momentum strength accurately
👉 Predict momentum shifts before everyone else (even the pros)
For Day Traders and Scalpers: If you rely on both indicators for quick entries, this tool streamlines confirmation so you can react faster in high-speed markets.
For Swing Traders: On higher timeframes, combining Bollinger Bands and RSI logic helps identify the beginning or exhaustion of larger moves.
For Any Strategy: Whether you trade breakouts, reversals, or trend continuation, this approach improves the confirmation process traditionally attempted with Bollinger Bands and RSI.
When traders rely on separate Bollinger Bands and RSI signals, hesitation is common.
With Momentous Volatility Bands, you can see what truly matters in the market. Instead of second-guessing every move, you’ll have clear signals that reveal when a trade is worth taking and when to stay out.
When momentum surges and volatility shifts, you won’t just wonder what’s going on: you’ll know whether it’s a strong move backed by real pressure or just noise that will fade away.
It’s time to stop guessing between Bollinger Bands and RSI signals and start trading with clarity.
Momentous Volatility Bands is the tool that tells you exactly what to do.
Click here to see this indicator in action