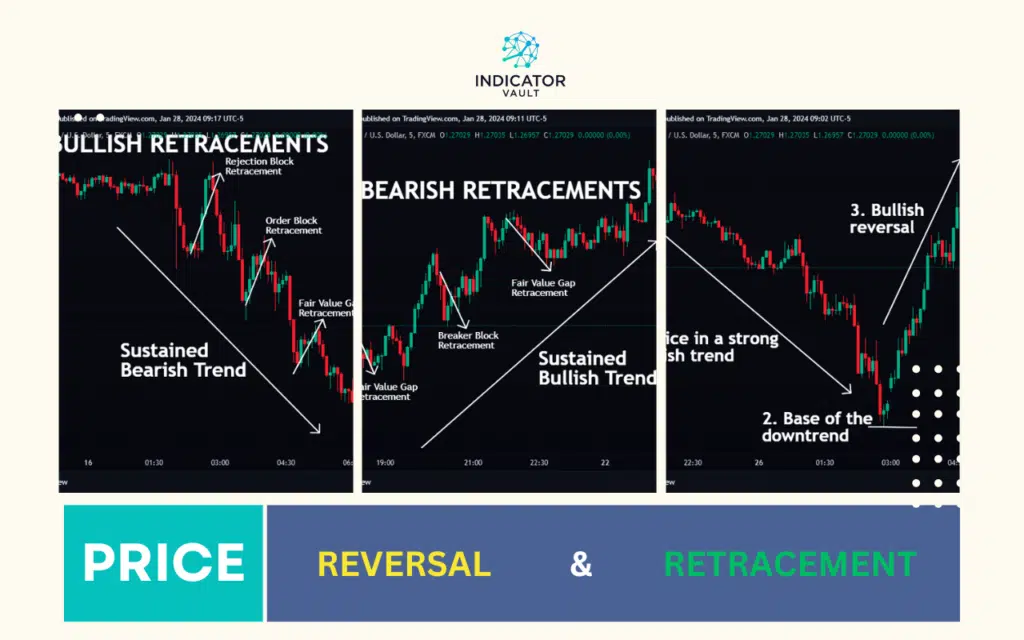
Discerning between price reversals & retracements is highly paramount for success. Dive into this guide to learn their definitions, similarities, & differences.
Table of Contents
1. Introduction:
‘Price reversal’ and ‘retracement’ are widely circulated trading terms. They uniquely define past and current market conditions, influencing forecasts and potentially determining results. Hence, understanding what they mean in this context is crucial for success.
This article covers the essentials of both concepts with a concise comparison. In addition, readers will receive a ground-breaking related tool to skyrocket trading outcomes regardless of skill level.
2. Price Reversal vs. Retracement: Fundamental Differences and Similarity:
In technical trading, ‘reversals’ and ‘retracements’ describe changes in price action. Both are basically market moves against the most recent prevailing trend.
However, the main distinction lies in the extent and duration.
Price reversals are complete trend shifts from bullish to bearish or bearish to bullish conditions. They demand a total switch in the sentiment of traders studying the markets during such periods.
Conversely, retracements are only short-term turnarounds in price within the significant prevailing trend. Traders consider them ‘minor reversals’ because the price continues in its primary direction sooner or later.
Understanding this difference equips traders to align with the existing market conditions for improved results. Otherwise, most will get caught on the wrong side of sustained moves with devastating consequences.
2.1. Deeper Insights Into Price Reversals:
A reversal means a switch in the primary trend direction, whether short- or long-term. Just before, the market attains the apex of sustained bullish runs or the base of significant bearish moves.
Below are two case scenarios of bullish and bearish price reversals:
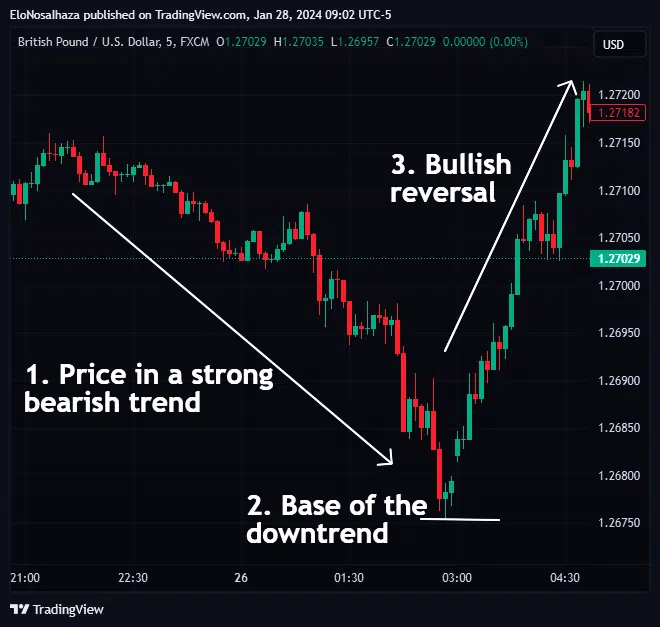
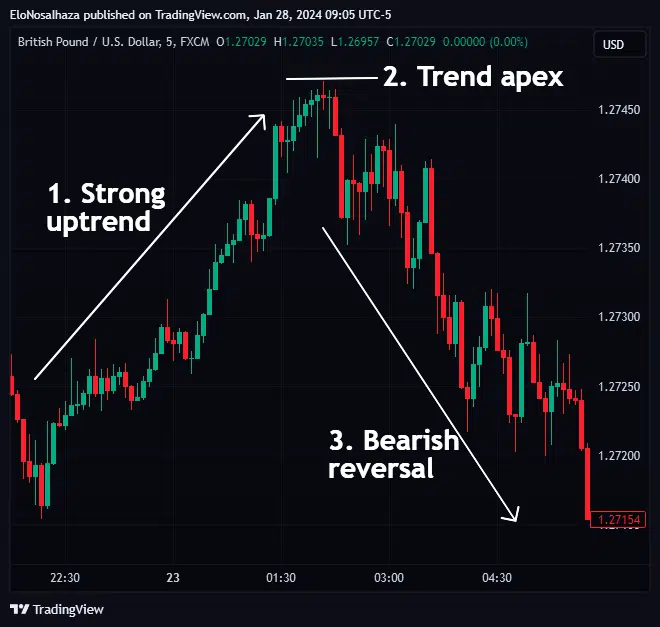
Traders hope to forecast reversals ASAP for either or both of the following reasons:
- Close any positions aligning with the previous trend
- Take trading opportunities in the new (potentially promising) direction
The latter is more challenging. Traders must first confirm it is a genuine reversal and not a retracement.
Several strategies involving fundamental signals, chart patterns, and indicators have proven helpful. For example, the classic head and shoulders pattern forms during bullish-bearish price reversals.
Another established technique involves the divergence theory.
When there’s a significant inconsistency among related instruments and indicators, pro traders interpret it as price weakness and anticipate a reversal in due time.
Anticipating and executing price reversal trades successfully can be highly rewarding. Traders can ride the entire trade from its outset.
Nonetheless, it’s easier said than done, as revealed by observational studies.
2.2. Understanding Price Retracements Better:
As discussed, price retracements are also moves against the prevailing trend, but only to a certain degree. It is a temporary reversal and an opportunity to seize the prevailing trend.
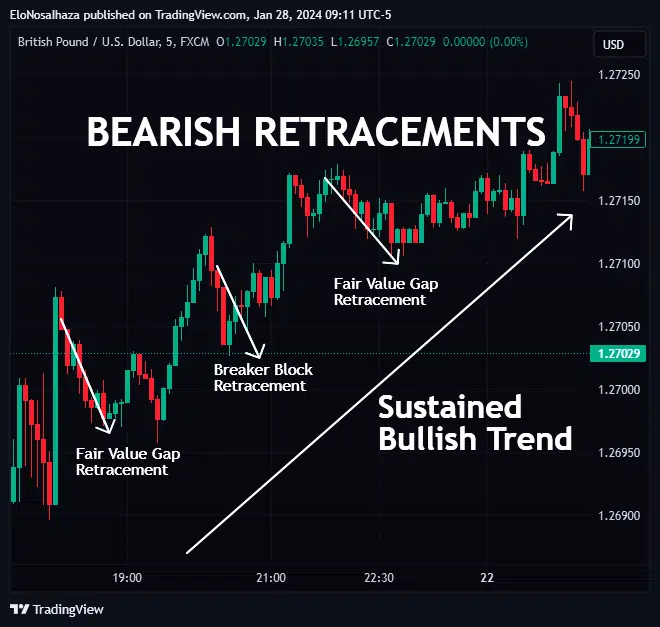
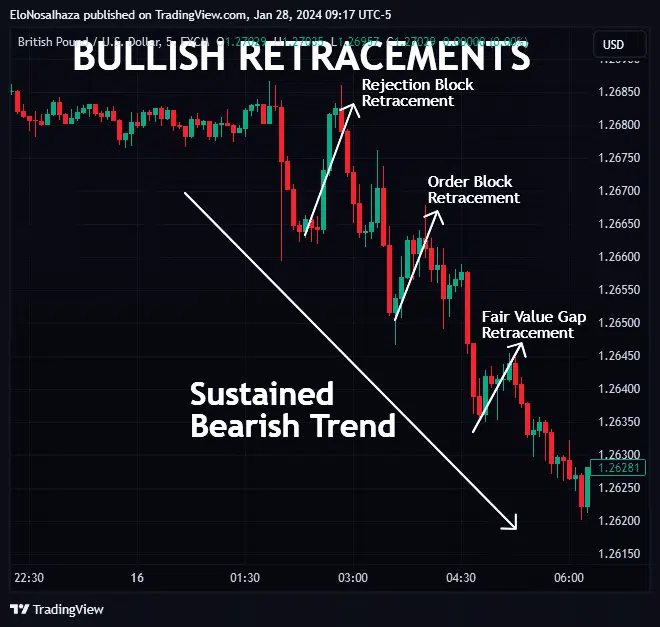
Despite being an opposing move, pro analysts generally consider retracements healthy for the overall trend. Many call them ‘pullbacks,’ giving rise to several pullback trading strategies.
One of the most popular options employs the Fibonacci tool. By anchoring it at swing highs and lows, traders anticipate pullback reactions at any projected level.
Another method involves the test of trendlines or Moving Averages (MA). The type of MA or points of trendline connection used is up to individual traders.
One noteworthy caveat with pullback trading is the uncertainty of how far and long the continuation move will last.
Thus, traders must always stick to their risk and money management rules to avoid contrary results.
3. Exploiting Retracements With the Pullback Factor for TradingView:
Regardless of one’s subscribed trading notions and discipline, retracements have and will always be part of solid trends. Financial markets use these corrections to deliver prices efficiently.
Hence, it’s best to devise ways to leverage such corrections.
Trendlines, MAs, and the Fibonacci tool have proven considerably efficient. However, the Pullback Factor for TradingView is miles ahead of every strategy.
It is a volatility-based technical tool that recognizes and signals pullbacks from beginning to end. This grants users the opportunity to partake in the continuation move stress-free.
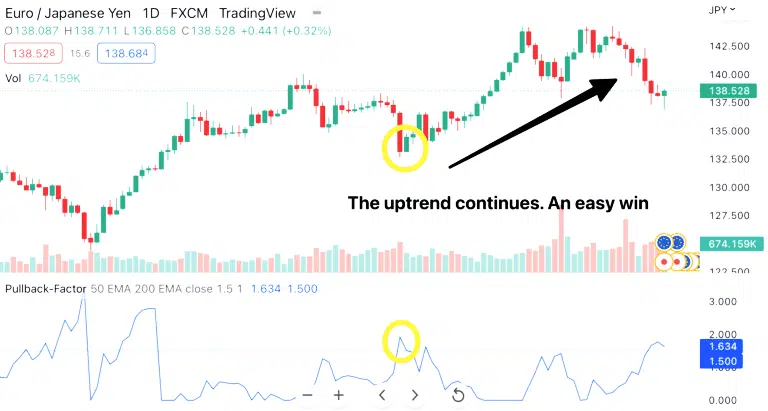
Succinctly, here are some perks the indicator offers over other techniques:
- Assurance of high-probability setups during pullbacks
- Early awareness of fake retracements and potential reversals
- Ability to explore several markets, including stocks, indices, and futures
- Quickest trade entry and exits, thanks to timely alerts within and outside TradingView
Confirm these and many more benefits by clicking here.
4. Conclusion:
Reversals and retracements signify a change in price direction. However, the former is more prolonged and significant than the latter, in which the market continues in its primary trend sooner or later.
Reversal trading strategies include reading fundamental data and anticipating chart patterns.
Similarly, pullback traders employ several recommended techniques to leverage retracements, like installing the Pullback Factor for TradingView.
Please share this article with friends, colleagues, and any ambitious retail trader. Also, remember to leave feedback in the ever-engaging Comment Section.

