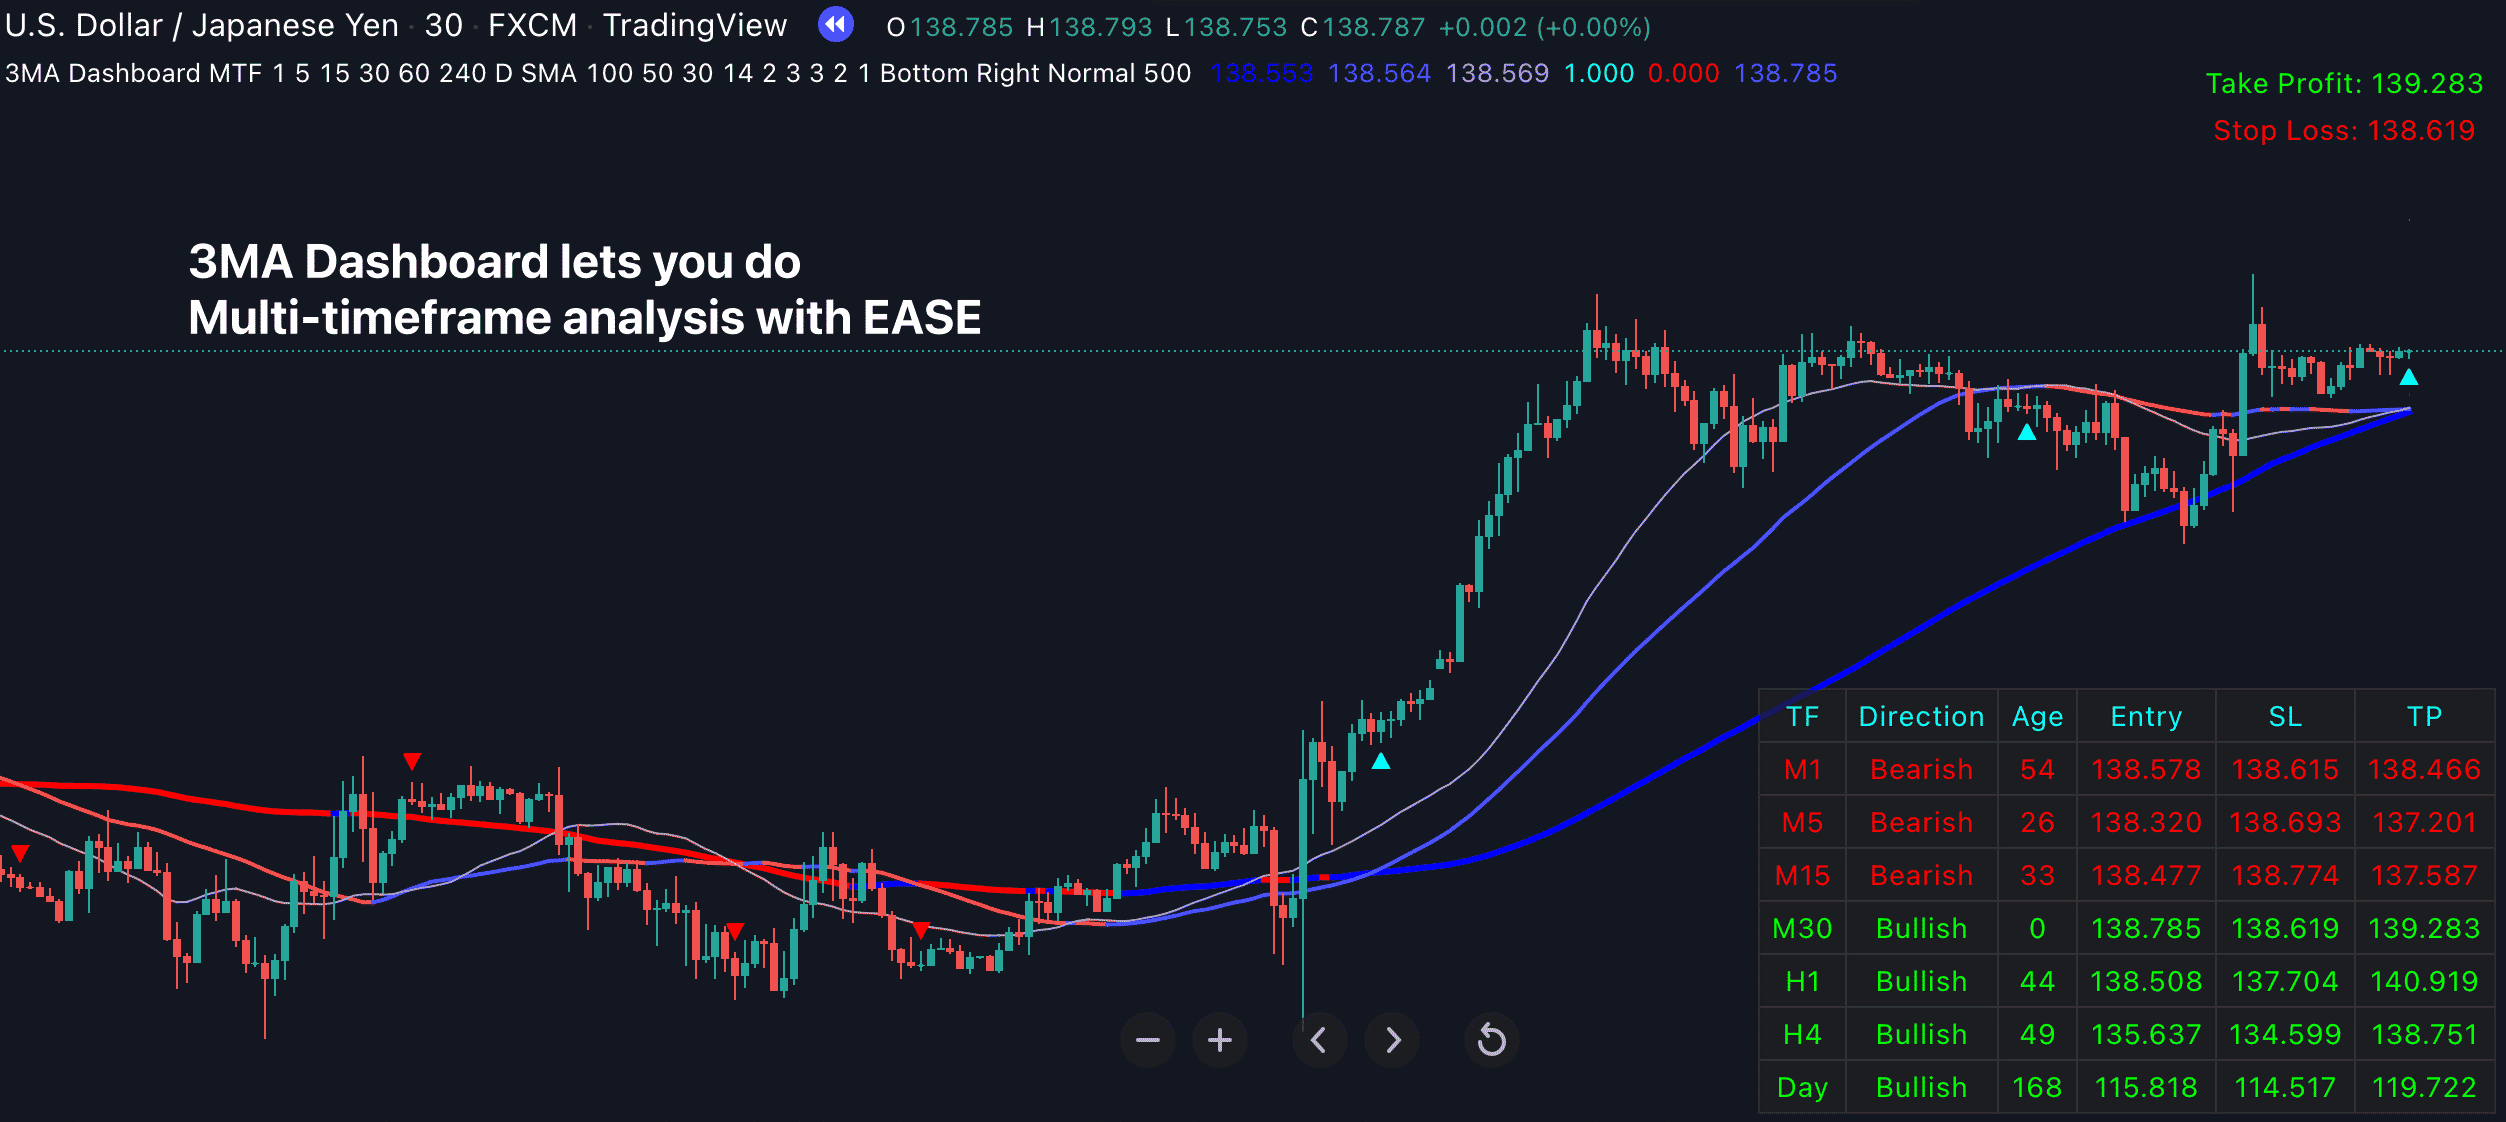
3MA Dashboard
📌 Scans up to 10 different symbols and 7 different timeframes for high-probability trend-following trade setups.
📌 When the long-term trend, and the medium-term trend, and the short-term trend are IN SYNC.
📌 It uses CUSTOM, NEXT-GENERATION Moving Average algorithm. And that could mean increased accuracy, increased versatility, and most importantly, LESS LAG.
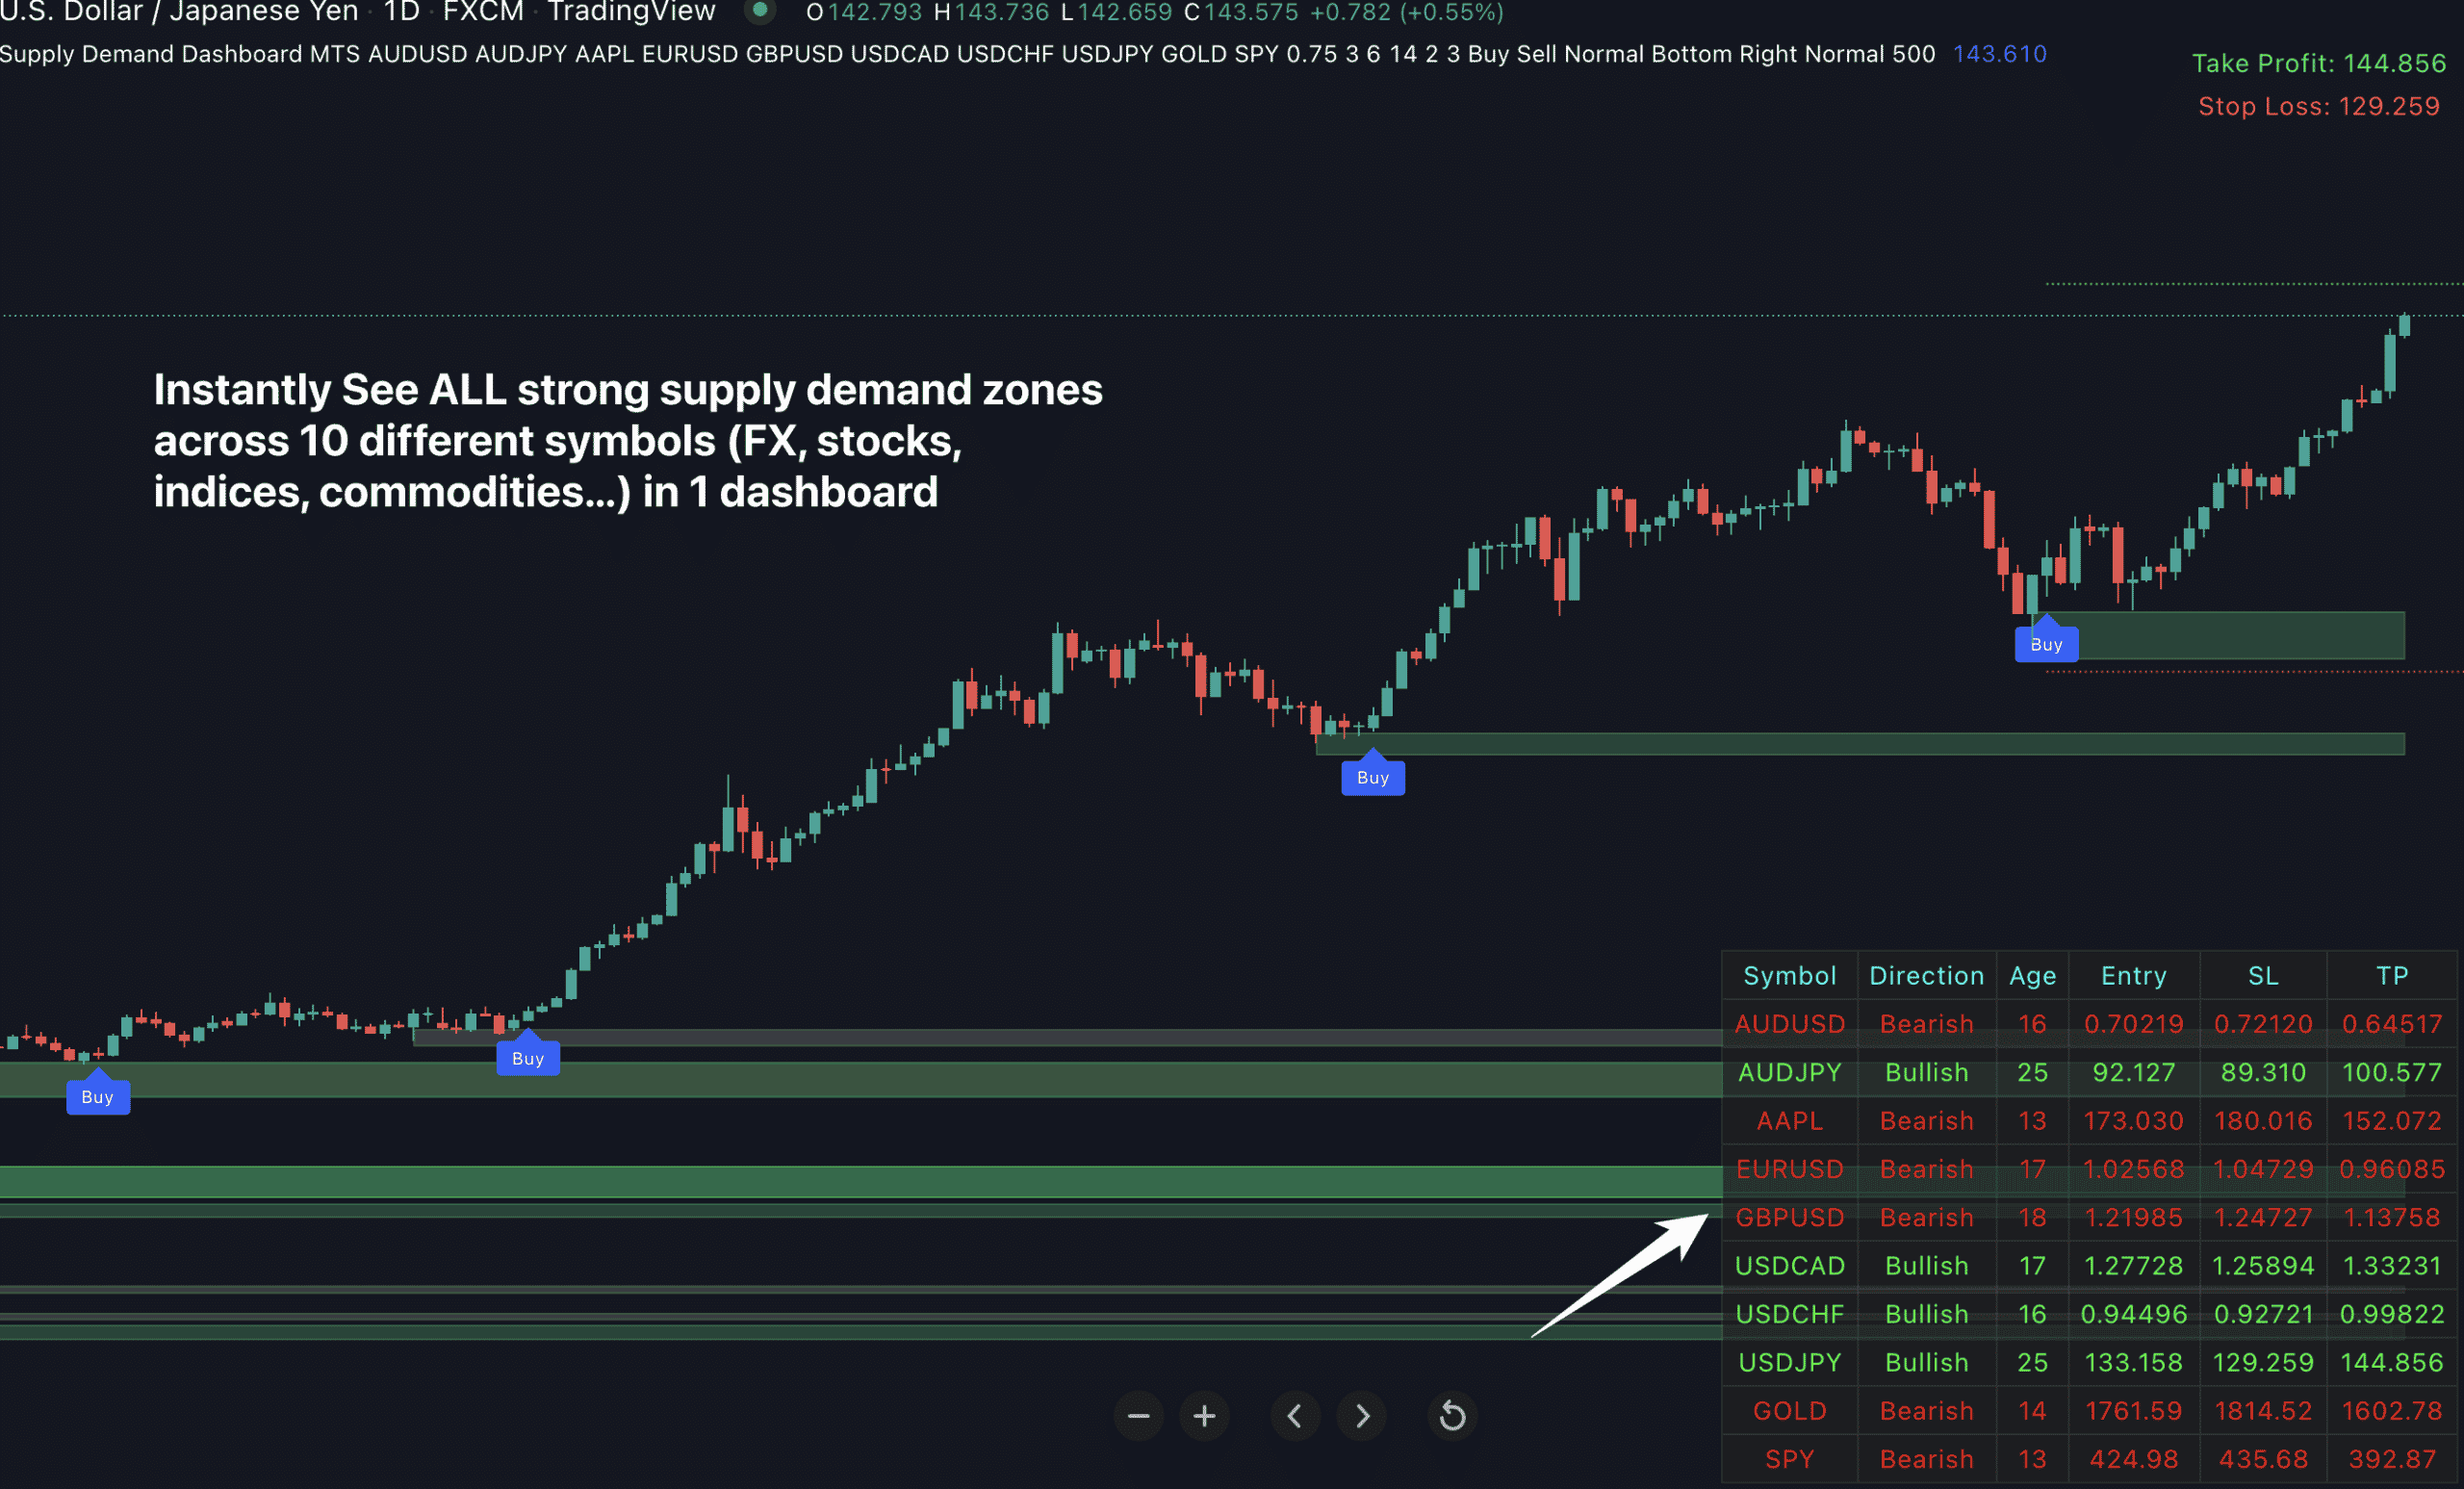
Supply Demand Dashboard for Tradingview
📌 This Supply Demand Dashboard for Tradingview shows you all strong supply demand zones in ONE convenient dashboard.
📌 You no longer need to manually scan every symbol and time-frame. The dashboard does the heavy lifting for you.
📌 With just one look at the dashboard, you’ll instantly know which supply demand zone has just formed on up to 10 symbols & 7 time-frame
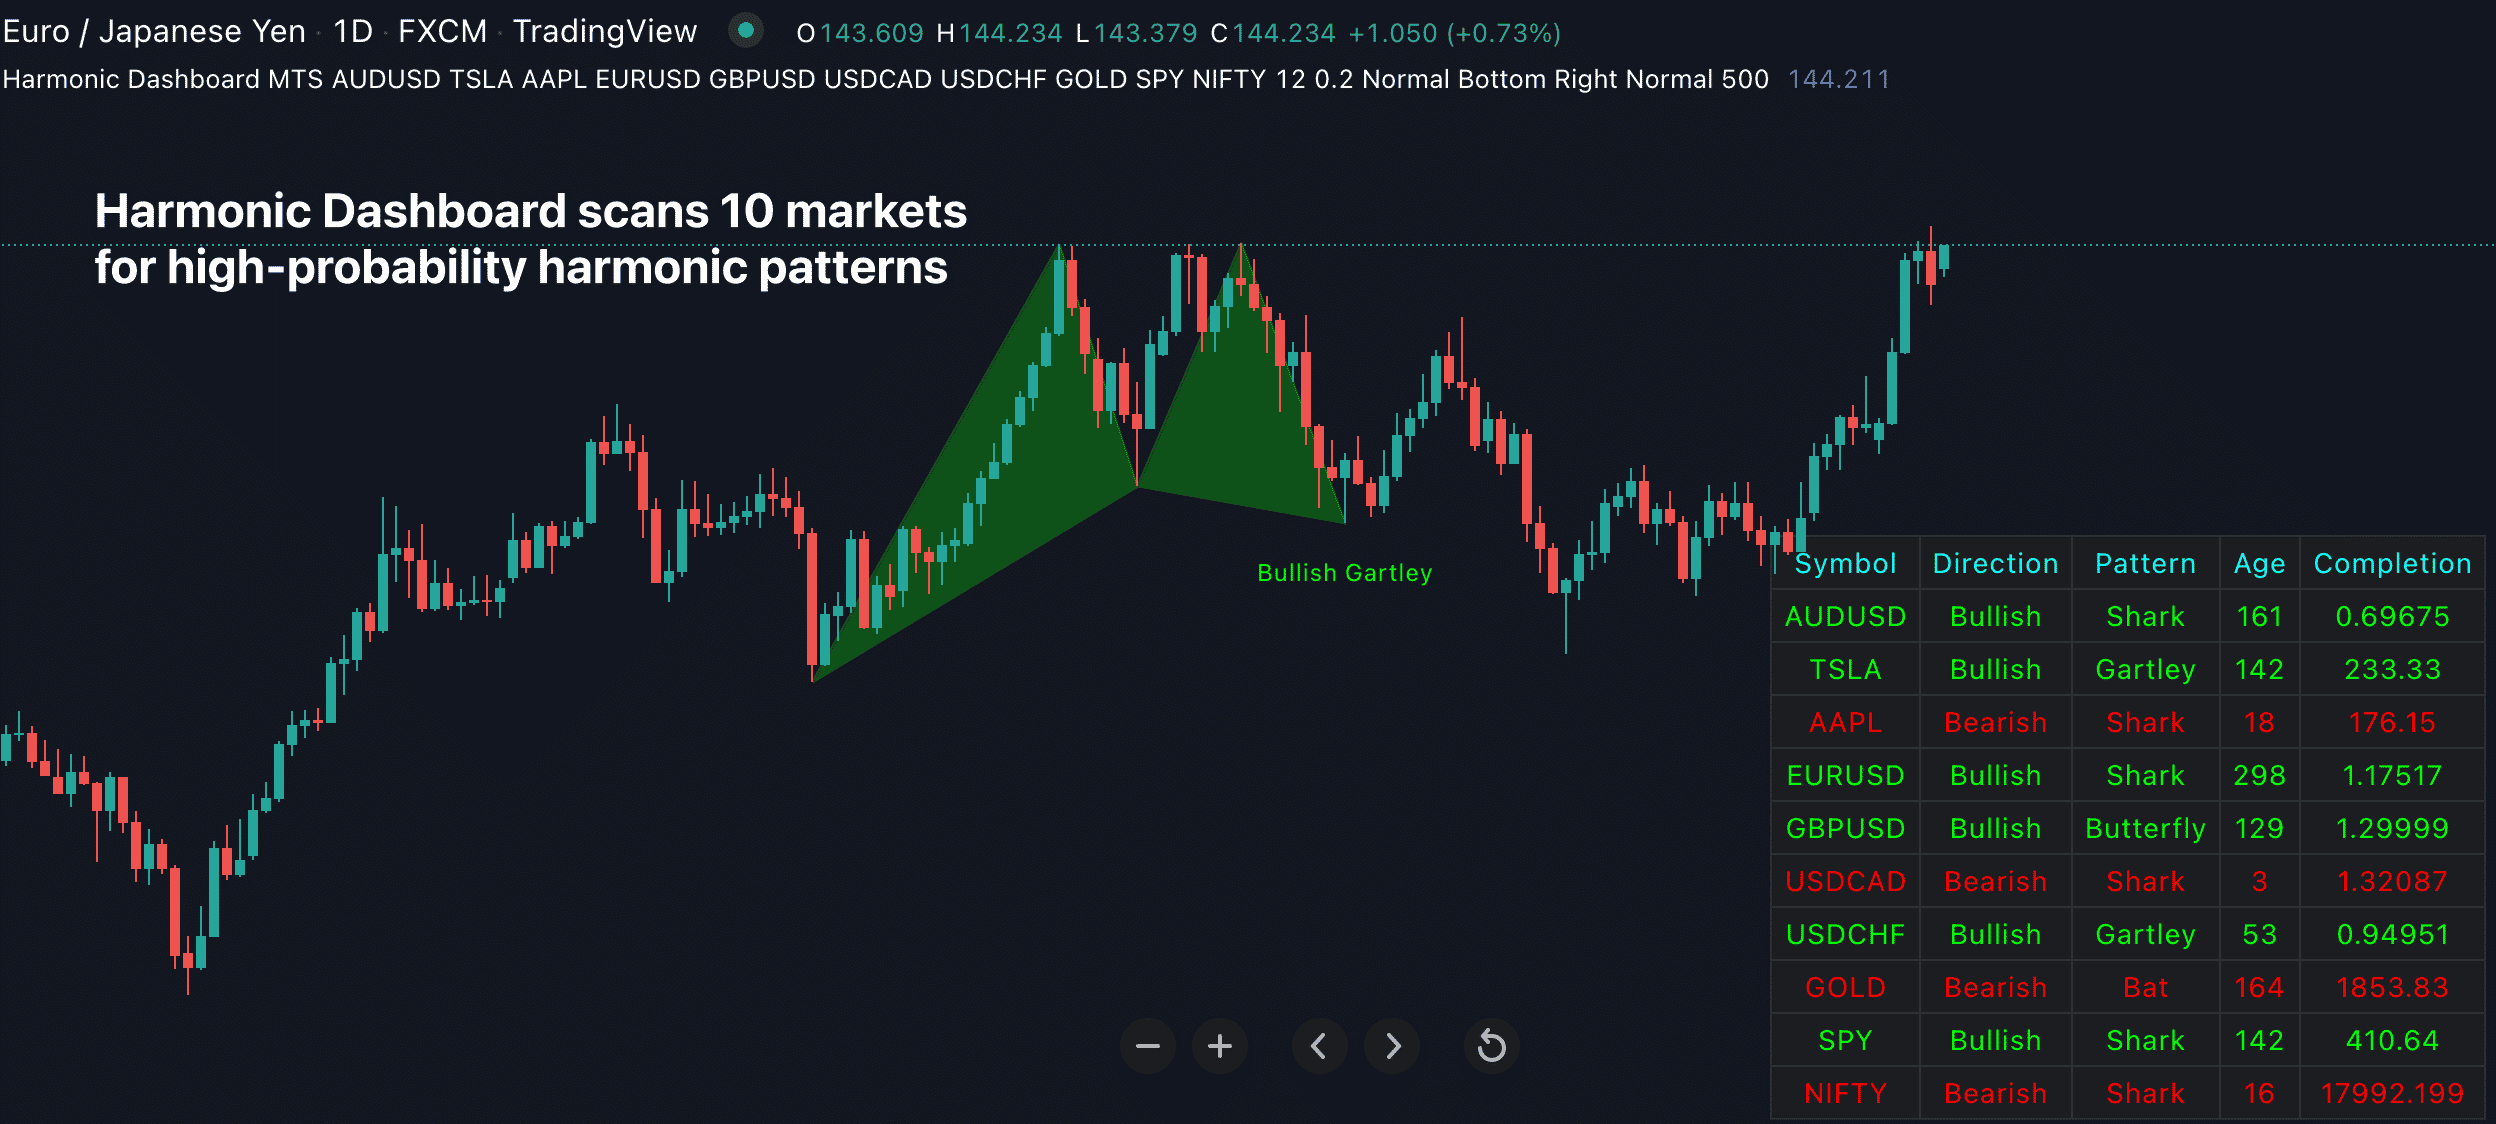
Harmonic Dashboard
📌 The scanner displays all detected patterns on ONE convenient dashboard. And it recognizes all of the best harmonic patterns: Gartley, Butterfly, Bat, Cypher, Crab, and Shark…
📌 You no longer need to manually scan every symbol and time-frame. The dashboard does the heavy lifting for you.
📌 With just one look at the dashboards, you’ll instantly know which harmonic pattern has just formed on 10 markets and 7 time-frames
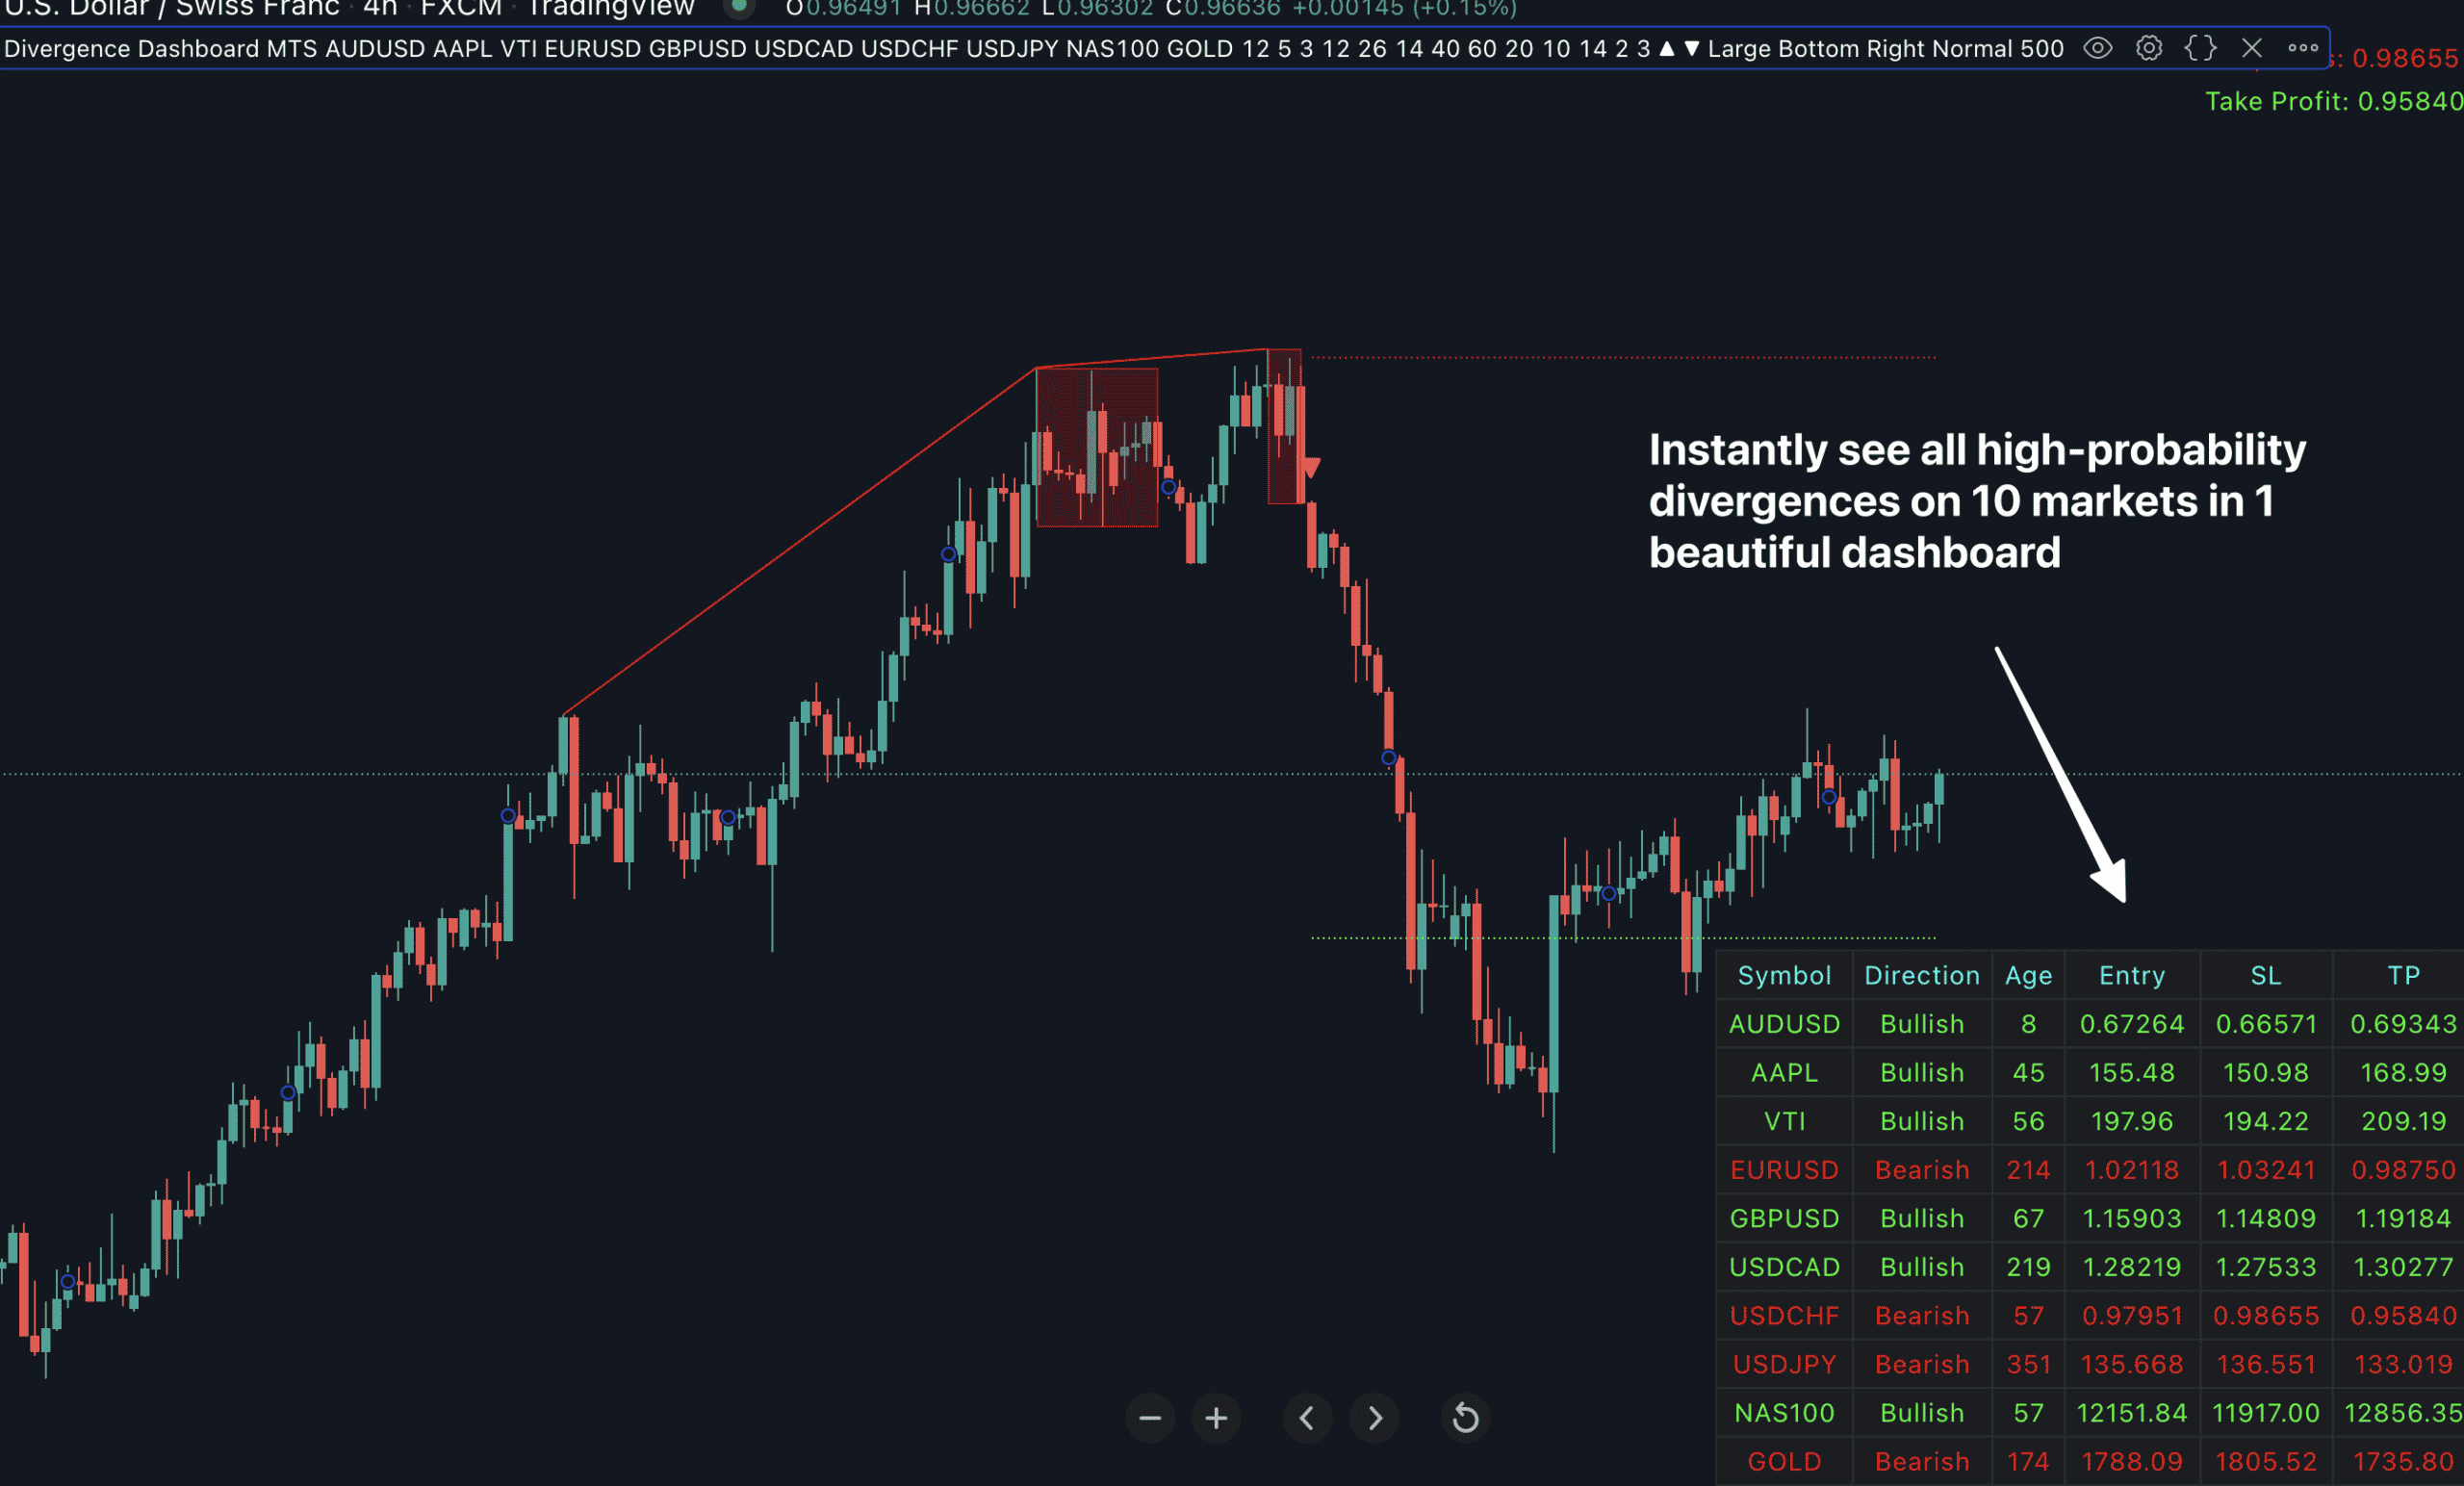
Divergence Dashboard
📌 These scanners detect high-probability divergences across 10 markets & 7 timeframes. And shows you every single setup in a beautiful dashboard.
📌 You no longer need to manually scan every symbol and time-frame for divergences. The dashboard does the heavy lifting for you.
📌 With just one look at the dashboards, you’ll instantly know which divergence-based trade setup has just formed on 10 markets and 7 time-frames
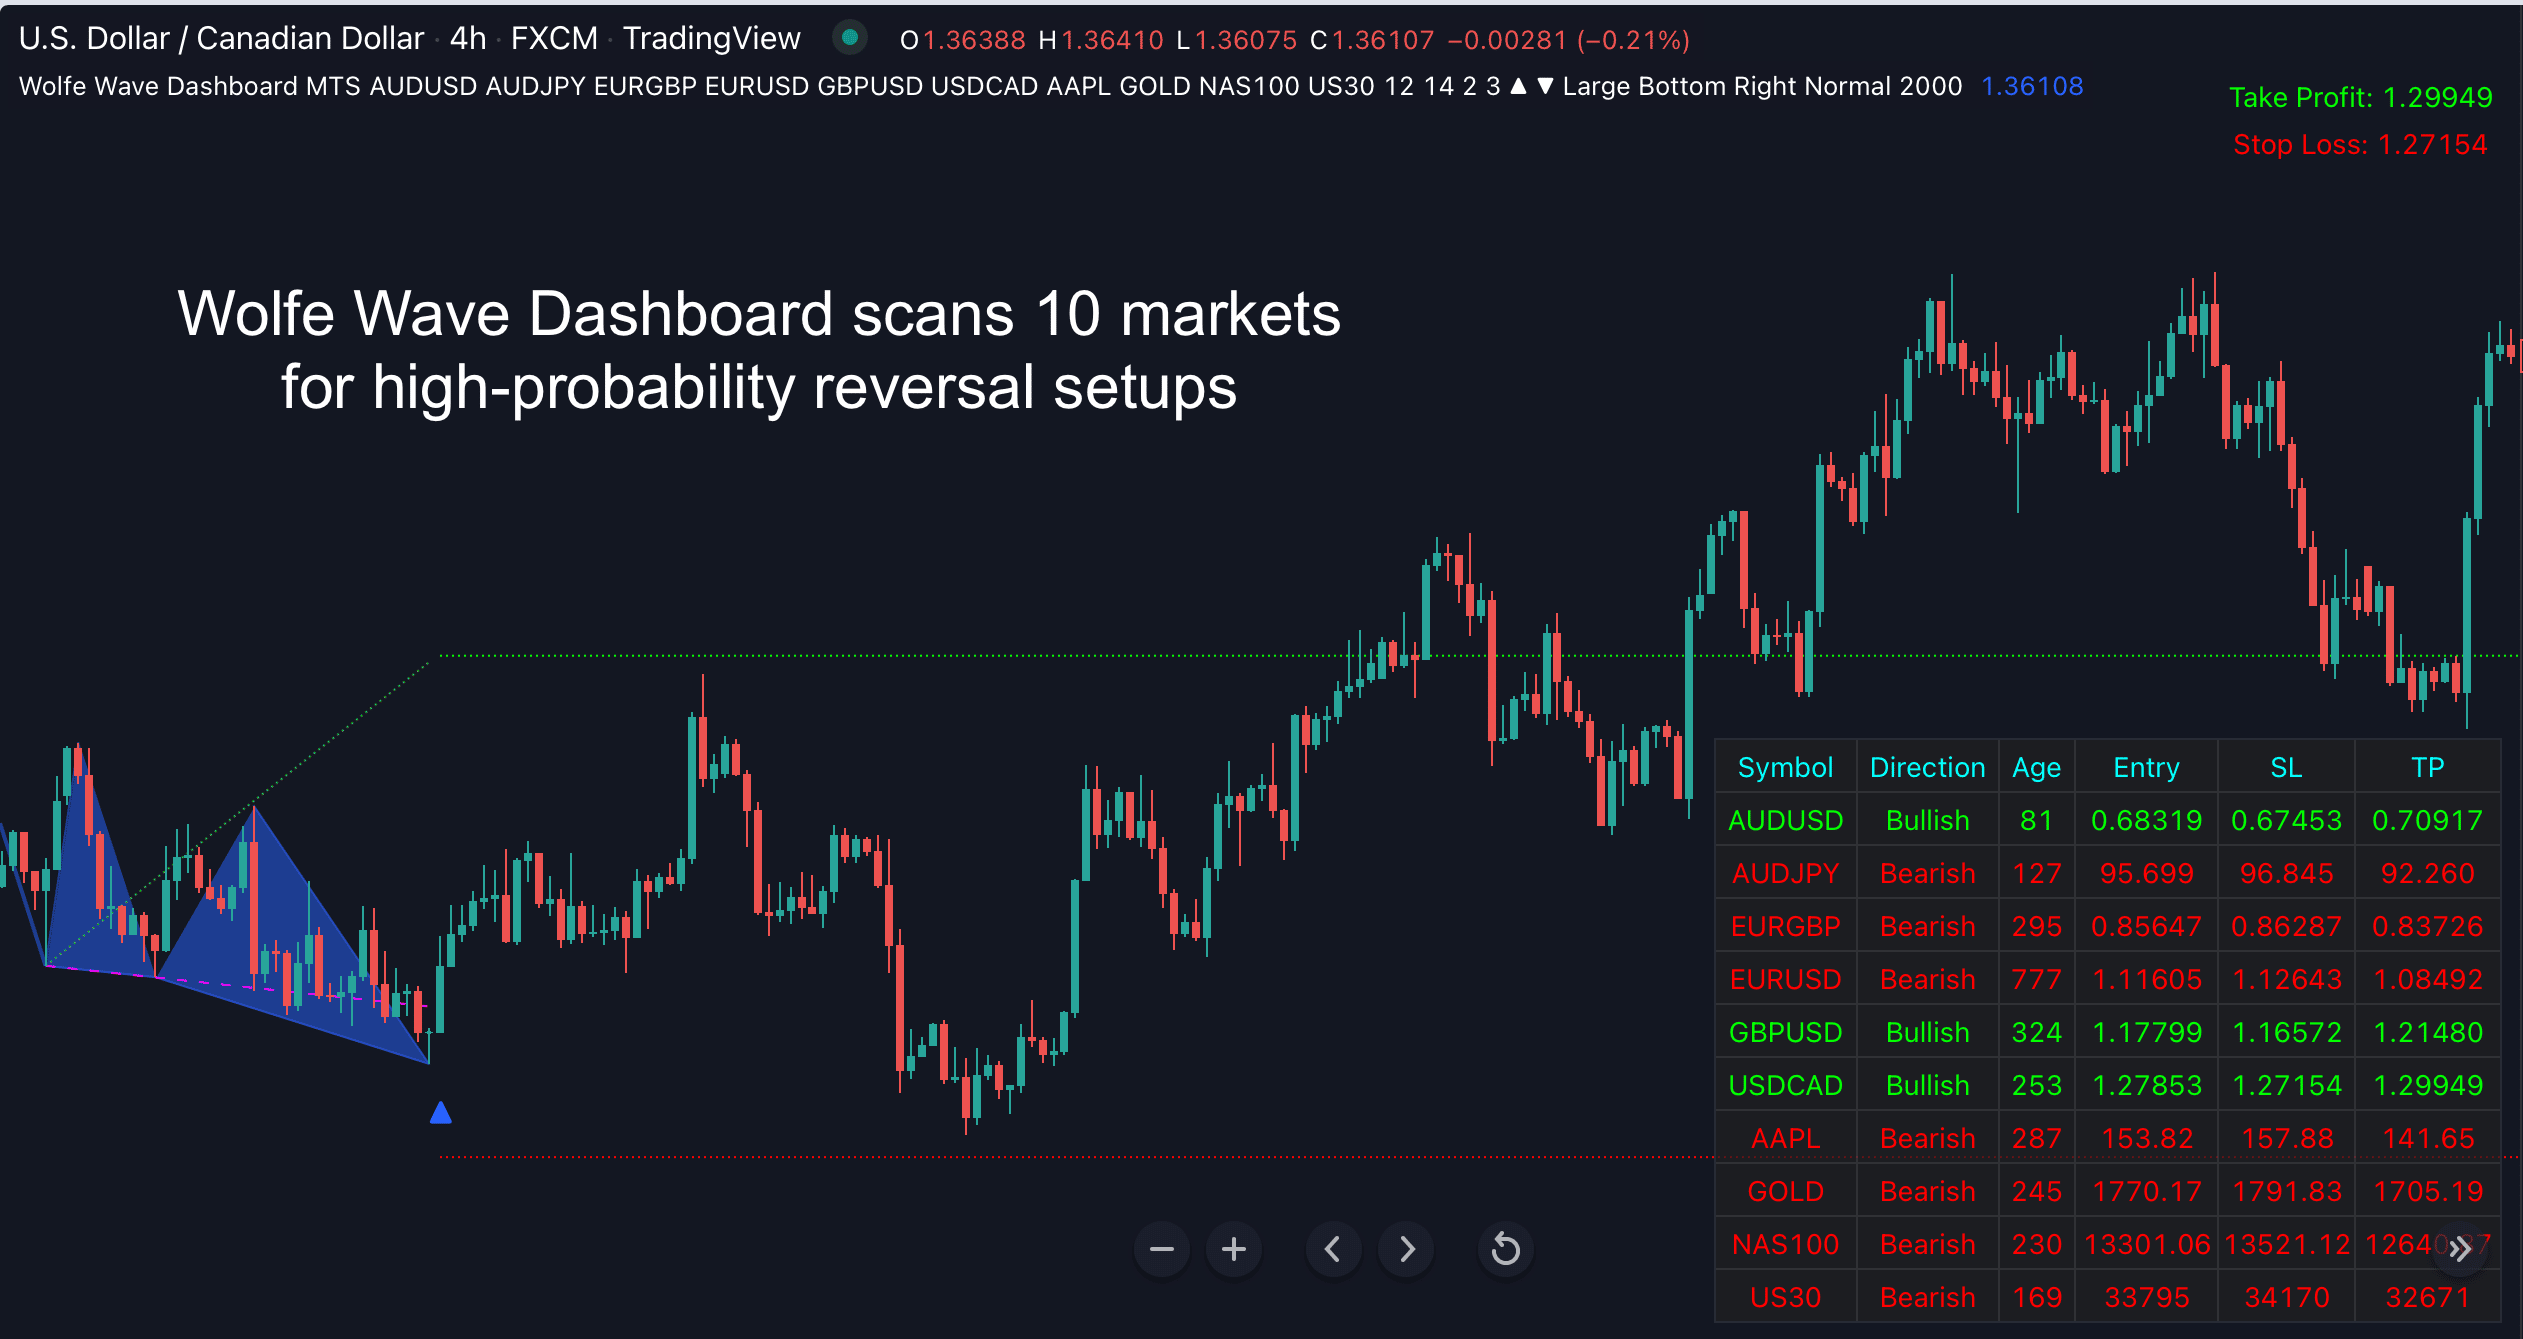
Wolfe Wave Dashboard
📌 Scans up to 7 timeframes for high-probability reversal patterns
📌 Sutomatically detects every single valid Wolfe Wave pattern on every time-frame, every currency pair..
📌 Scan 10 markets and 7 time-frames for ALL high-probability setups
works equally well for BOTH day trading and swing trading…
(click here to learn more about this indicator…)
📌 This Supply Demand Dashboard for Tradingview shows you all strong supply demand zones in ONE convenient dashboard.
📌 You no longer need to manually scan every symbol and time-frame. The dashboard does the heavy lifting for you.
📌 With just one look at the dashboard, you’ll instantly know which supply demand zone has just formed on up to 10 symbols & 7 time-frame
(click here to learn more about this indicator…)
The “3MA Dashboard for Tradingview” indicator scans up to 10 different symbols and 7 different timeframes for high-probability trend-following trade setups.
(click here to learn more about this indicator…)
📌 The scanner displays all detected patterns on ONE convenient dashboard. And it recognizes all of the best harmonic patterns: Gartley, Butterfly, Bat, Cypher, Crab, and Shark…
📌 You no longer need to manually scan every symbol and time-frame. The dashboard does the heavy lifting for you.
📌 With just one look at the dashboards, you’ll instantly know which harmonic pattern has just formed on 10 markets and 7 time-frames
(click here to learn more about this indicator…)
📌 These scanners detect high-probability divergences across 10 markets & 7 timeframes. And shows you every single setup in a beautiful dashboard.
📌 You no longer need to manually scan every symbol and time-frame for divergences. The dashboard does the heavy lifting for you.
📌 With just one look at the dashboards, you’ll instantly know which divergence-based trade setup has just formed on 10 markets and 7 time-frames
(click here to learn more about this indicator…)
It will scan 10 markets and 7 time-frames for ALL high-probability setups


