
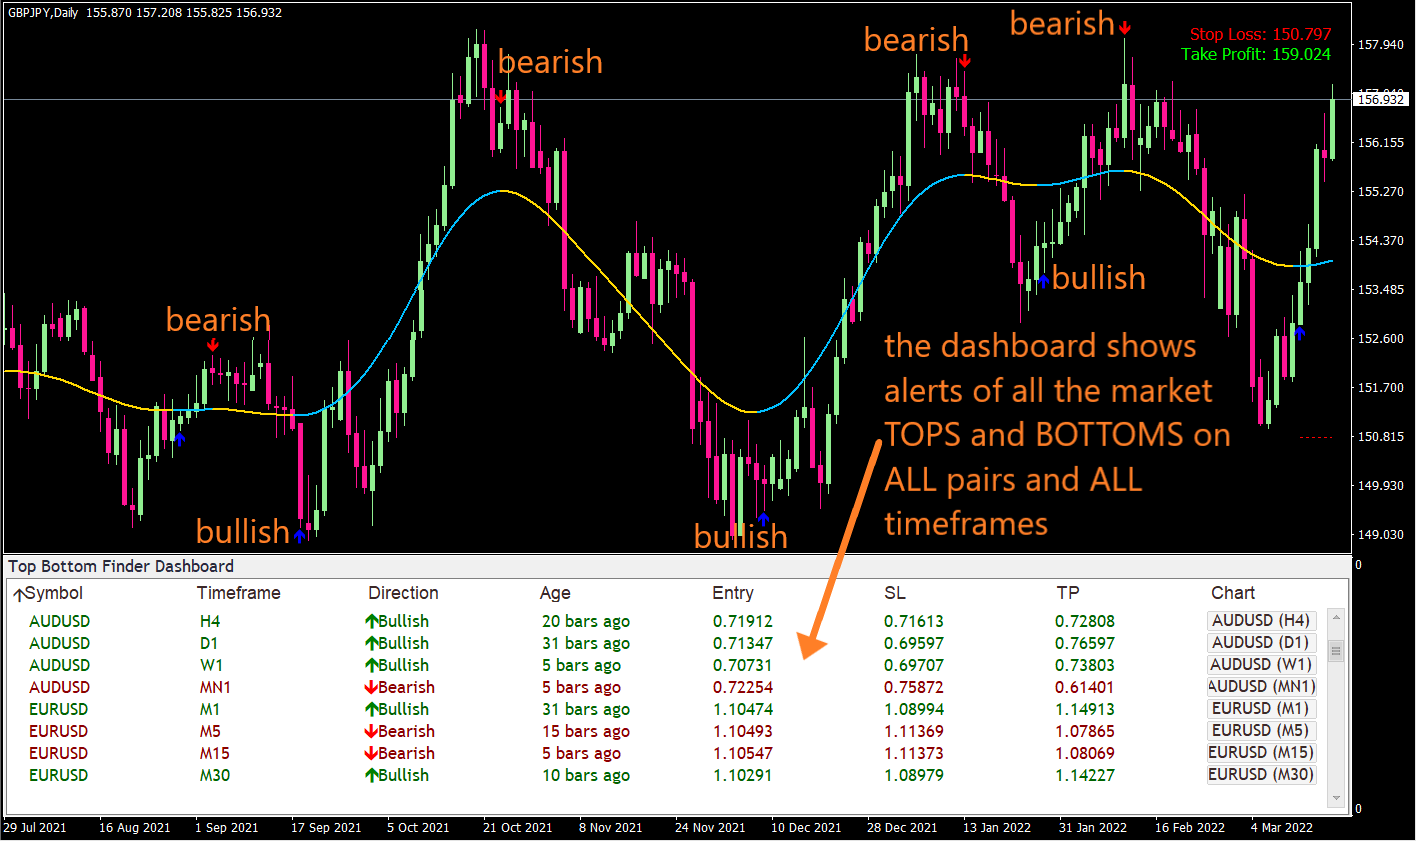
Top Bottom Finder Dashboard
If you like picking tops & bottoms, this is a God-send: New "Top Bottom Finder Dashboard" uses K Smoothing algorithm to find TOPS and BOTTOMS on ALL pairs and ALL timeframes.
Smooth Trend Dashboard
Top-notch trend scanner searches every pair & timeframe in real time for the highest-probability trade setups, and brings about an easy-as-pie WINNING strategy

Chart Pattern Dashboard
Sneaky MT5 indicator quietly spies on "Institutional Order Blocks" to find market reversals...
- All
- MT4
Smooth Trend Dashboard
📌 Spots the start of new trends at the right time across ALL pairs and timeframes. So you can extract the most profits from the markets.
📌 Notifies you of highest-probability trade setups on all symbols and timeframes in an INSTANT manner. Helps you save a lot of time and avoid missing great trade setups.
📌 Gives you only the best entries to join new trends on all pairs. Brings you a new WINNING strategy which is EASY AS PIE.
Top Bottom Finder Dashboard
📌 You’ll get instant notifications of all the market tops and bottoms on ALL pairs and ALL timeframes. So you can extract the most profits from the market.
📌 Display all the well-timed trade alerts of ALL the pairs in ONE neat dashboard.
📌 Use the Kernel Smoothing algorithm to identify high-probability trade setups on all pairs and all timeframes. You’ll no longer miss any good trade setup again.
Harmonic Dashboard
📌 The indicator displays all detected patterns on ONE convenient dashboard. And it recognizes all of the best harmonic patterns: Gartley, Butterfly, Bat, Cypher, Crab, and Shark…
📌 You no longer need to manually scan every pair and time-frame. The dashboard does all the hard work for you.
📌 With just one look at the dashboard, you’ll instantly know which harmonic pattern has just formed on every pair and every time-frame (from 1-minute to monthly)…
Wolfe Wave Dashboard
📌 Wolfe Wave Dashboard indicator displays all detected Wolfe Waves on ONE convenient dashboard.
📌 You no longer need to manually scan every pair and time-frame. The dashboard does all the hard work for you.
📌 With just one look at the dashboard, you’ll instantly know which pattern has just formed on every pair and every time-frame (from 1-minute to monthly)…
Reversal Dashboard
✅ The indicator displays all detected Reversal (and Continuation) patterns on ONE convenient dashboard.
✅ You no longer need to manually scan every pair and time-frame. The dashboard does all the hard work for you.
✅ With just one look at the dashboard, you’ll instantly know which pattern has just formed on every pair and every time-frame (from 1-minute to monthly)…
Day Trading Dashboard
📌 “Day Trading Dashboard” detects high-probability trade setups based on price action ONLY. Reacts to changes in market condition very fast, so you can capture the best trade opportunities.
📌 Shows you the most accurate patterns based on breakouts and consolidation zones.
📌 You no longer need to manually scan for these patterns on every pair and time-frame. The dashboard does all the hard work for you.
📌 With just one look at the dashboard, you’ll instantly know which day trading pattern has just formed on every pair and every time-frame (from 1-minute to monthly)…
Candlestick Dashboard
📌 The indicator displays all detected patterns on ONE convenient dashboard. And it recognizes over 30 powerful candlestick patterns (including reversal, continuation, trend exhaustion patterns — and single, double, and triple candlestick patterns…)
📌 You no longer need to manually scan every pair and time-frame for candlestick patterns. The dashboard does all the hard work for you.
📌 With just one look at the dashboard, you’ll instantly know which candlestick pattern has just formed on every pair and every time-frame (from 1-minute to monthly)…
Chart Pattern Dashboard
✅ The indicator displays all detected patterns on ONE convenient dashboard. And it recognizes all of the best price breakout patterns: Head and Shoulders, Reverse Head and Shoulders, Rising Wedge, Falling Wedge, Triangle, Double Top, Double Bottom, Triple Top, Triple Bottom…
✅ You no longer need to manually scan every pair and time-frame. The dashboard does all the hard work for you.
✅ With just one look at the dashboard, you’ll instantly know which chart pattern has just formed on every pair and every time-frame (from 1-minute to monthly)…
Trend Trading Dashboard
✅ The Trend Trading Dashboard scans IN REAL TIME all pairs and timeframes for 3 kinds of trend-trading setups: beginning of new market trends… AND pullback setups… AND breakout setups…
✅ Then, it displays all of these high-probability setups on a beautiful, convenient dashboard. So you can easily see which setup has recently formed on the pair you’d like to trade.
✅ Most traders overlook some of the best trading opportunities that an established trend offers. But not you… YOU can spot them all with the new Trend Trading Dashboard…
Price Action Dashboard
✅ The indicator displays all detected Price Action patterns on ONE convenient dashboard.
✅ You no longer need to manually scan every pair and time-frame. The dashboard does all the hard work for you.
✅ With just one look at the dashboard, you’ll instantly know which pattern has just formed on every pair and every time-frame (from 1-minute to monthly)…
Divergence Dashboard
📌 The Divergence Dashboard indicator displays all detected divergence-based trade setups on ONE convenient dashboard.
📌 You no longer need to manually scan every pair and time-frame. The dashboard does all the hard work for you.
📌 With just one look at the dashboard, you’ll instantly know which trade setups has just formed on every pair and every time-frame (from 1-minute to monthly)…
Advanced Harmonics Scanner
The indicator displays all detected patterns in ONE convenient dashboard. And it recognizes 6 ADVANCED harmonic patterns: AB = CD, Alternate AB = CD, Deep Crab, 5-0, Three Drives, Alternate Bat..
📌 You no longer need to manually scan every pair and time-frame. The dashboard does all the hard work for you.
📌 With just one look at the dashboard, you’ll instantly know which harmonic pattern has just formed on every pair and every time-frame (from 1-minute to monthly)…
Scalping Dashboard
📌 The Scalping Dashboard indicator displays all detected scalping trade setups in ONE convenient dashboard.
📌 You no longer need to manually scan every pair and time-frame. The dashboard does all the hard work for you.
📌 With just one look at the dashboard, you’ll instantly know which trade setups has just formed on every pair and every time-frame (from 1-minute to monthly)…
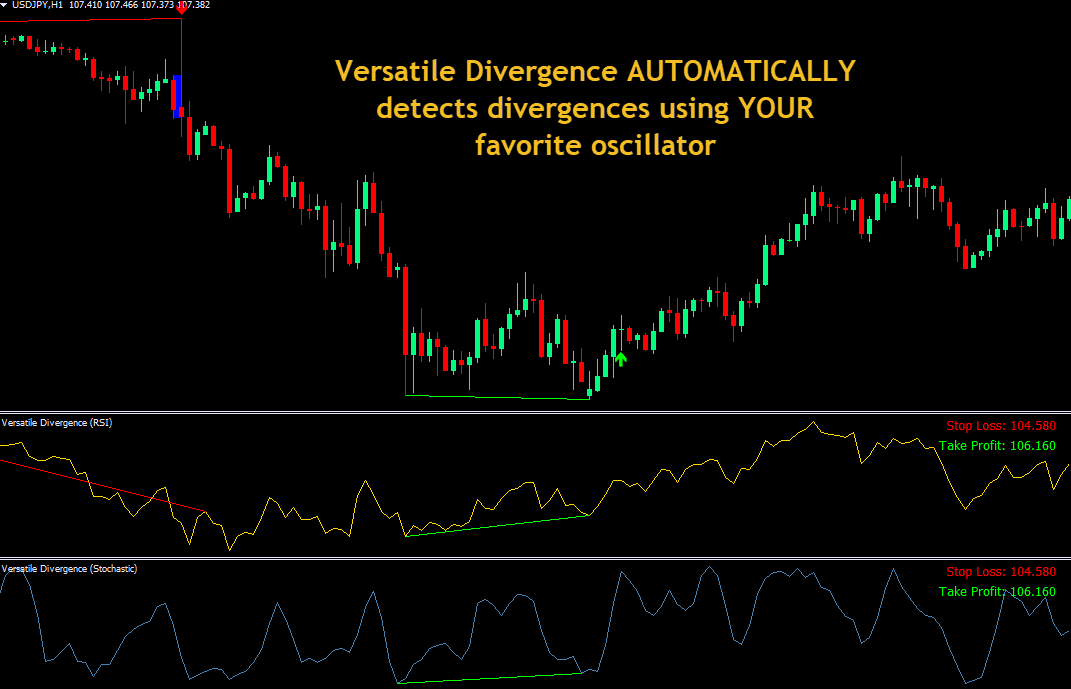
Versatile Divergence
✅ The indicator AUTOMATICALLY detects all of the high-probability divergences on ANY symbol and ANY timeframe you’d like.
✅ The indicator shows you entries and exactly where to place your stop loss & take profit.
✅ You can load the Versatile Divergence indicator MULTIPLE times on the same chart using DIFFERENT oscillators.
Hidden Divergence Dashboard
✅ The Hidden Divergence Dashboard indicator displays all detected trade setups based on hidden divergence in ONE convenient dashboard.
✅ You no longer need to manually scan every pair and time-frame. The dashboard does all the hard work for you.
✅ With just one look at the dashboard, you’ll instantly know which trade setups has just formed on every pair and every time-frame (from 1-minute to monthly)…
Swing Trading Dashboard
📌 The Swing Trading Dashboard indicator displays all detected swing trade setups in ONE convenient, easy-to-use dashboard.
📌 You no longer need to manually scan every pair and time-frame. The dashboard does all the hard work for you.
📌 With just one look at the dashboard, you’ll instantly know which high-probability trade setups has just formed on every pair and every time-frame (from 1-minute to monthly)…

RSI Divergence Scanner
📌 The RSI Divergence Scanner indicator displays all detected RSI divergences in ONE convenient scanner.
📌 You no longer need to manually scan every pair and time-frame. The scanner does all the hard work for you.
📌 With just one look at the scanner, you’ll instantly know which trade setups has just formed on every pair and every time-frame (from 1-minute to monthly)…
Stochastic Divergence Scanner
✅ The Stochastic Divergence Scanner indicator displays all detected divergence-based trade setups in ONE convenient dashboard.
✅ You no longer need to manually scan every pair and time-frame. The scanner does all the hard work for you.
✅ With just one look at the scanner, you’ll instantly know which trade setups has just formed on every pair and every time-frame (from 1-minute to monthly)…

Better Oscillator Dashboard
✅ The Better Oscillator Dashboard indicator displays the trend of ALL pairs and ALL timeframes in ONE convenient dashboard.
✅ You no longer need to manually scan every pair and time-frame. The dashboard does all the hard work for you.
✅ With just one look at the dashboard, you’ll instantly know which trade setups has just formed on every pair and every time-frame (from 1-minute to monthly)…

MACD Dashboard
📌 With just one look at the dashboard, you’ll instantly know the MACD trend direction on every pair and every time-frame (from 1-minute to monthly)…
📌 Click on ANY symbol you want on the dashboard, and the indicator will immediately open that symbol’s chart for more detailed analysis.
📌 You can sort the dashboard in any way you like — based on Symbol, Timeframe, Direction…
📌 The dashboard works equally well for day traders, swing traders, and long-term traders…
Dual Divergence Dashboard
📌 The Dual Divergence Dashboard indicator displays all detected trade setups based on our world-famous Dual Divergence concept in ONE convenient dashboard.
📌 You no longer need to manually scan every pair and time-frame. The dashboard does all the hard work for you.
📌 With just one look at the dashboard, you’ll instantly know which trade setups has just formed on every pair and every time-frame (from 1-minute to monthly)…

Many thanks to Indicator Vault for sharing all the helpful indicators. Discretionary trading is very difficult, and as the world inevitably works more with automation, it will be leaning on indicators for EA/Robot placement.
1,000 smiles...Peace on Earth

IndicatorVault has made my trading so much easier. I was recommended by a friend. Good visual of trades and easy to analyze. It's definitely a good investment.

The premium collection is worth it and the best deal! Depending on your style there is an indicator for everything. And you can try them all out if you like to see which ones work with your strategy. For me, the Nadaraya Watson Estimator - based indicators are very helpful. And some of the swing indicators. Others not so much. Get as much computing power as you can afford as indicators will tax your processor especially on lower time frames and longer bar counts. And trust me, you won’t be satisfied with just one at a time! Trying each one out will help you arrive at the optimum collection for your strategy.

There's a treasure trove of indicators and each has its own usefulness. One way is try out these indicators by having a mix and match each indicators or use their recommendations of their indicators. Most importantly, is to have the patience to try it out and you'll get the results. Closest thing to an EA. Definitely recommended.