A support and resistance strategy is one of the most widely used techniques in technical analysis. By identifying key price levels where buyers or sellers dominate, traders can anticipate potential reversals, breakouts, and high-probability trade setups.
Table of Contents
1. Introduction
The support and resistance strategy has long caught technical analysts’ attention due to their reliability and relative simplicity. They unravel significant market points with the greatest price influence. Thus, what makes the principles so impactful in the trading world?
This article explores the psychology behind these levels and explains how professional traders apply a support and resistance strategy to maximize returns. As an incentive, readers will also gain invaluable access to a jaw-dropping innovation predicated on this universal strategy.
2. The Fundamentals and Psychology Behind Support and Resistance Zones
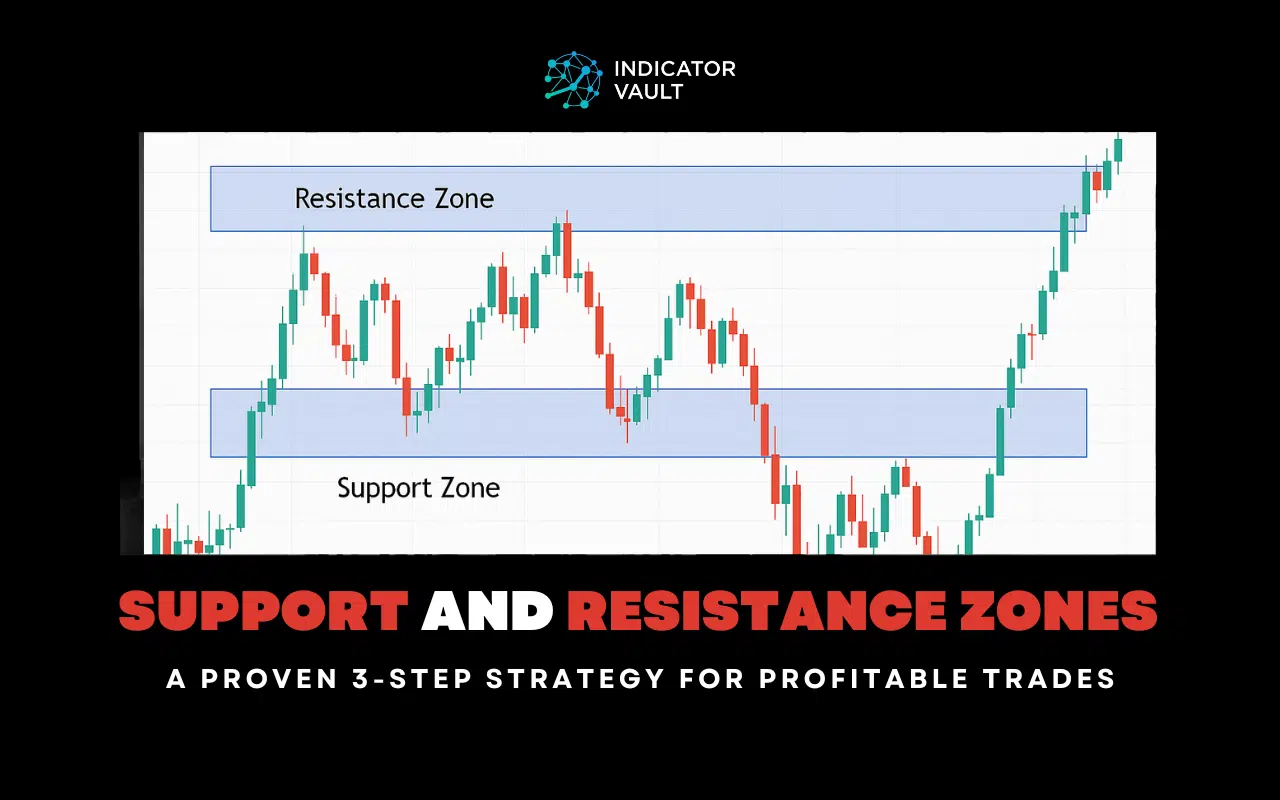
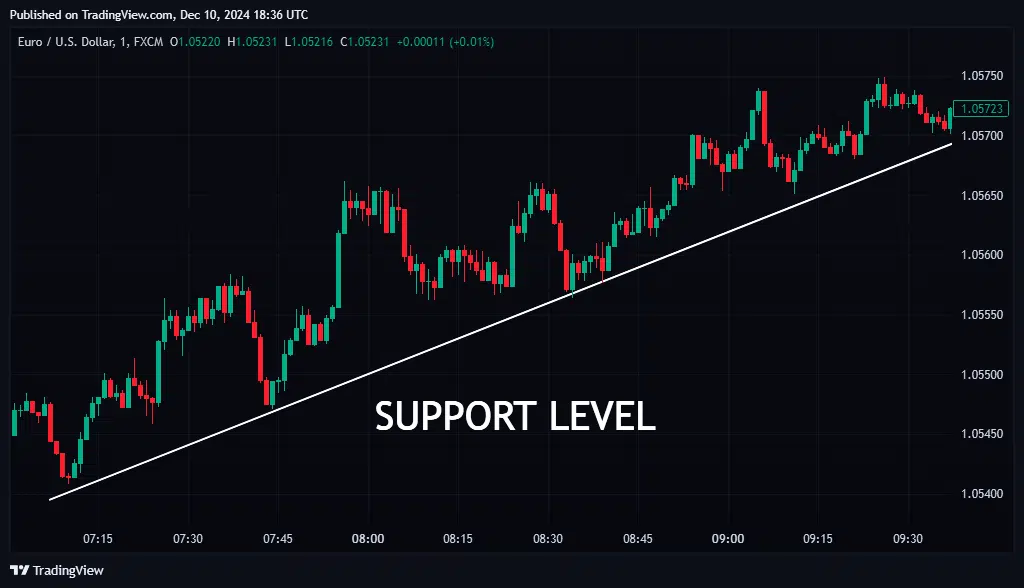
In technical analysis, a support zone is any point below the market that prevents its price from declining lower. It is strong enough to ‘support’ the financial asset’s activity above.
Within a support and resistance strategy, traders expect bullish reversals whenever price approaches a strong support level.
A weak support zone can’t prevent an uptrend reversal, and the price continues to decline beyond that point.
A support zone can emerge from trendlines, moving averages (MAs), Fibonacci retracement levels, liquidity voids/gaps, pivot points, etc.
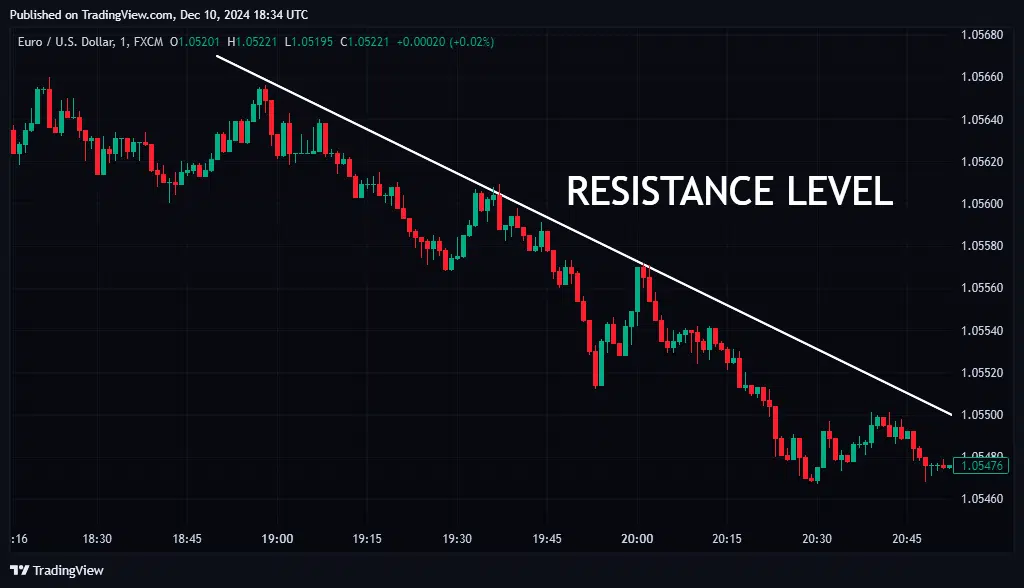
On the other hand, a resistance zone lies above the financial market. It prevents a bullish trend from rising further based on its strength.
Therefore, in a support and resistance strategy, traders anticipate bearish reversals whenever the price approaches a strong resistance level.
If the resistance zone is strong enough, the market can’t resist a turnaround, no matter how promising the bullishness appears.
Conversely, a weak resistance zone allows the uptrend to move beyond it without much opposition.
Like support zones, resistance points can be old swing highs and lows, trendlines, liquidity voids, Fibonacci retracement points, and previous breakout levels.
Professional technical analysts believe in the potency of these zones because other human investors are the most active market participants.
Owing to the human perceptions and emotions involved, these levels represent the collective psychology of traders, making them powerful.
For instance, imagine a currency pair bounced off a trendline multiple times within a relatively short period. This would influence traders to believe such an action will repeat whenever the price approaches the line.
The collective market sentiment becomes bullish at that point, eventually influencing the reversal.
Several retail traders, old and new, record significant success rates with support and resistance principles.
However, it is much more complex and multi-faceted, requiring deeper research for improved understanding.
3. How To Trade With Support and Resistance Strategy
The support and resistance strategy is one of the most commonly applied methods in technical analysis. It involves identifying key chart levels, above and below the market, for decision-making.
Below is a simplified approach, step-by-step:
3.1. Mark Out These Levels
The first and arguably most essential step involves identifying the support points and resistance points at any time. They can range from a few levels to an unlimited number.
Search for chart points where the price has reversed upwards many times. Typically, those are the support levels of varying strengths.
Similarly, chart levels above the current price that have ensured bearish reversals whenever the market approached them are the resistance points.
Traders can identify these levels with simple drawing tools, like trendlines connecting descending/ascending highs and lows.
Horizontal lines also reveal the significant chart points in any time frame, and the MA is another more dynamic option.
3.2. Confirm The Levels
As discussed, support and resistance levels can be strong or weak. The former would have kept the market from breaking beyond it more times than the latter.
Thus, one must confirm the strength of these levels for improved performance.
A stronger support/resistance point may also be present during a high volume (trading activity) session after detailed analysis.
Further, combinations with the RSI, MACD, or Fibonacci tools increase the reliability of the support and resistance strategy and reduces false signals.
3.3. Respect the Chart Levels in Any Strategy
All other trading methods must respect the support/resistance chart levels after confirming them.
In one way or another, they are reversal strategies or breakout techniques.
Buying near the support and selling near the resistance after confirming with other signals is the norm for reversal trading. A stop loss order can be slightly below the level.
In breakout trading, traders wait for the market to violate a strong support/resistance point with momentum before selling/buying.
4. Seize Every Promising Opportunity With The Pivot Staircases
Although the support and resistance strategy is powerful, many traders struggle with accurately identifying the correct levels. Incorrect level selection often leads to poor trade results.
Therefore, Indicator Vault’s Pivot Staircases for Tradingview for TradingView is one of the best companions for support-resistance trading.
It reveals dynamic levels to provide precise range, breakout, and reversal alerts on any market or time frame desired.
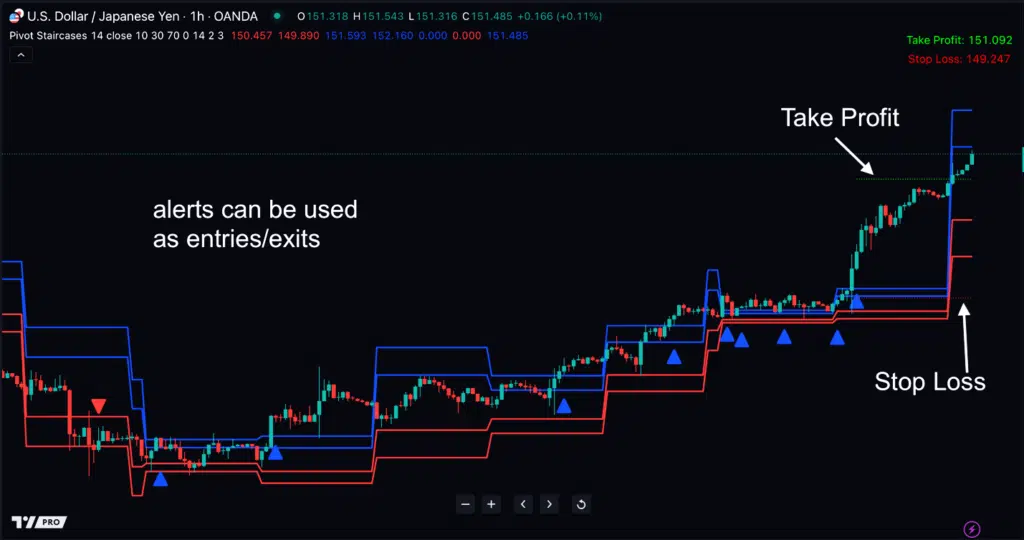
Concisely, here are a few benefits every user relishes from its application:
- Awareness of the best support and resistance levels in the live markets
- Earliest identification of breakout and reversal opportunities
- Freedom to explore any market and time frame desired
- Assurance of taking every opportunity owing to the tool’s reliable alert system
Hard to believe? Get prepared to be amazed by the results today!
5. Summary
Support and resistance strategy ideas are some of the most promoted in every technical analysis circle.
The concepts depend on significant chart levels, influencing bullish or bearish trend reversals.
Traders expect these levels to be influential due to human involvement in the financial market and its impact on price moves.
Below are the three basic steps involved in trading with support-resistance zones:
- Identification of the levels
- Confirmation
- Influence of chart levels in every strategy
One of the most recommended indicators for support and resistance trading is the Pivot Staircases for TradingView. It identifies the key levels quickly in any market and time frame.
Please share this article with fellow traders of all experience levels and leave feedback below for engaging discussions.