Table of Contents
1. The Core Distinction: Reversal vs. Retracement
A Price Retracement is a temporary, short-term counter-move against the prevailing trend. It’s considered a healthy pullback that allows the market to cool off before resuming its primary direction.
A Price Reversal is a sustained, fundamental change where the dominant market force shifts, causing a complete and lasting switch in the direction of the primary trend (e.g., from an uptrend to a downtrend).
The key difference between a reversal and a retracement lies in its duration, magnitude, and structural impact on the price chart.
A Price Retracement is a temporary, short-term pause where the major trend remains intact, driven primarily by profit-taking and market cooling off. It is typically shallow, respecting key Fibonacci levels (e.g., 38.2%).
Conversely, a Price Reversal is a sustained, long-term shift that results in a complete change in the major trend direction (e.g., Bullish to Bearish). Reversals are deep and significant, breaking major long-term support and resistance, and are driven by a fundamental change in market supply and demand dynamics.
2. Deep Dive: How to Spot a True Price Reversal
A price reversal occurs when the dominant market force changes, leading to a sustained shift in the primary trend. Identifying a true reversal is highly rewarding, as it allows traders to capture the entire move from its beginning, but it is also the most challenging signal to confirm.
2.1 Key Indicators for Trend Reversal Confirmation
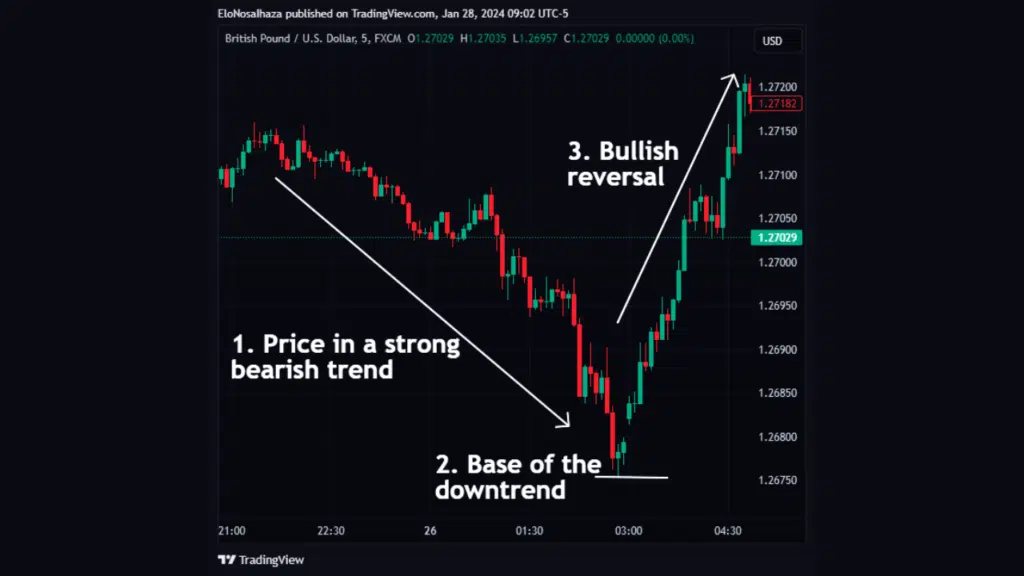
Trading a reversal requires patience and confirmation from multiple tools, not just a single candle stick.
- Momentum Divergence: One of the most established signals. Look for moments where the price continues to make new highs (in an uptrend) or new lows (in a downtrend), but a momentum oscillator (like the RSI or MACD) fails to confirm the move, signaling underlying weakness.
- Volume Spikes: A surge in trading volume at extreme highs or lows often confirms that a significant number of participants are exiting the market or entering in force, supporting the new trend direction.
- Break of Major Structure: The most obvious signal is the break of significant long-term support or resistance zones. In an uptrend, a reversal is confirmed when the price breaks below the prior swing low.
2.2 Classic Reversal Chart Patterns
Traders frequently use price action formations to anticipate a trend change:
- Head and Shoulders (and Inverse H&S): A highly reliable pattern indicating a transition from bull to bear (or vice-versa).
- Double Tops and Double Bottoms: Suggests that the market has tested a price level twice and failed to break through, indicating exhaustion and a coming reversal.
- Triple Tops/Bottoms: Similar to the Double pattern but with an extra test of the key level, often confirming even stronger price conviction.
3. Mastering Price Retracements for Trend Continuation
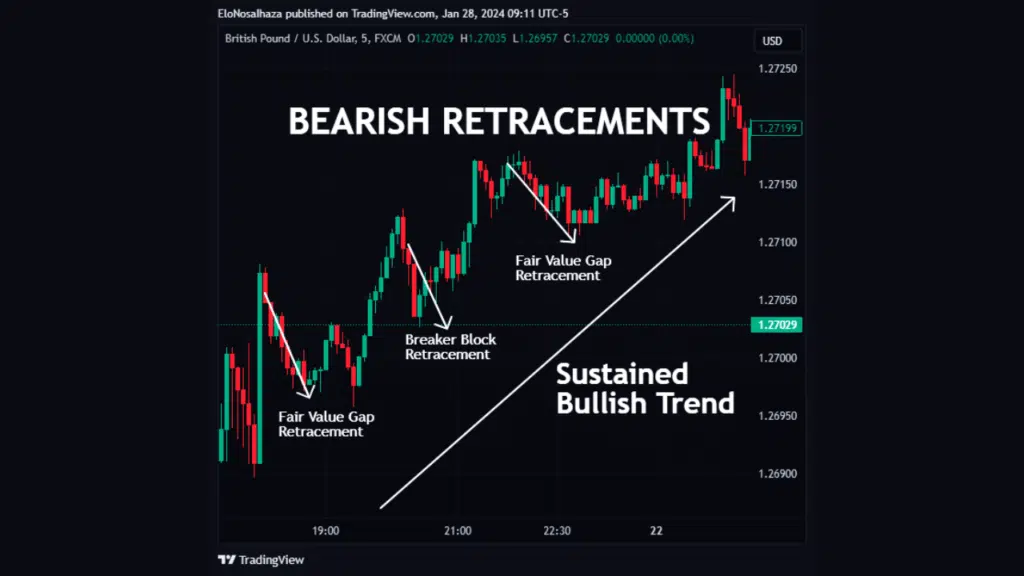
A price retracement, or pullback, is a temporary counter-move within a powerful, established trend. These short-lived counter-trend movements are considered healthy because they allow the market to cool off, shed weaker positions, and gather liquidity before continuing the primary move.
Trading retracements—or pullback trading—is a strategy used by trend-following traders to enter the primary trend at a more favorable, lower-risk price point.
Best Retracement Trading Strategies
Instead of trying to trade the reversal, pullback traders wait for the market to complete its short-term correction and look for evidence that the primary trend is resuming.
- Fibonacci Retracement Tool: This is the most common tool. By drawing Fibonacci lines from the swing low to the swing high (or vice versa), traders anticipate that the retracement will find support/resistance at the $38.2\%$ or $50\%$ levels before the trend continues. The $61.8\%$ level is often considered the final line of defense before a potential full reversal.
- Moving Average (MA) Test: Many traders use a long-term moving average (like the 50-period or 200-period MA) as a “dynamic support/resistance.” A retracement that moves back to test and bounce off a rising MA is a classic continuation signal.
- Support/Resistance Flip: A key principle in technical analysis is the role-reversal of price levels. When a market breaks above a former resistance level, it often retraces back down to test that same level, which then acts as new support before moving higher.
4. Practical Trading Scenarios: Retracement vs. Reversal
To solidify your understanding, let’s look at two common trade setups that highlight the difference between profiting from trend continuation (retracement) versus trend change (reversal).
4.1 Scenario A: The Retracement Trade (The MA Bounce)
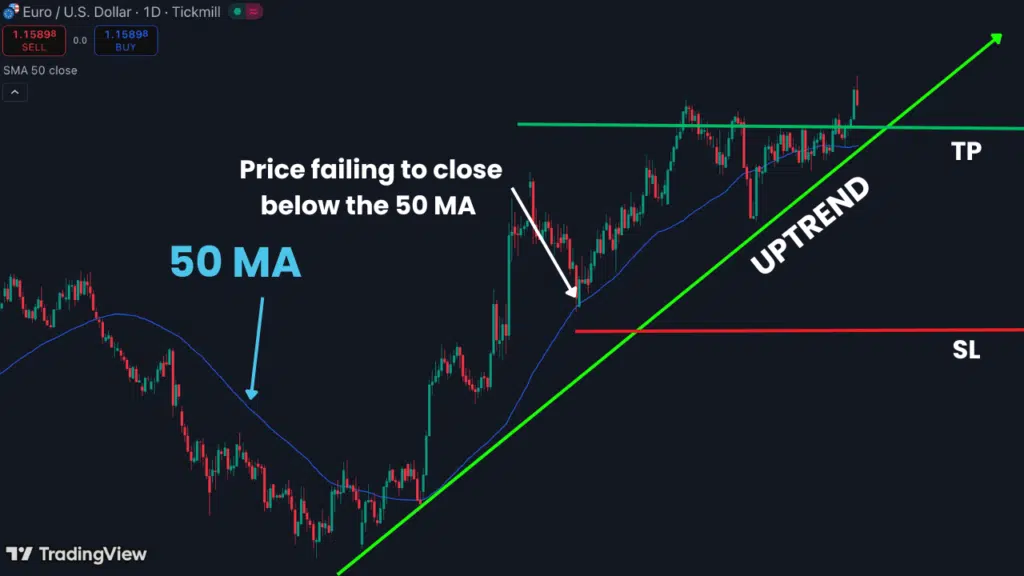
- Market Context: The EUR/USD currency pair has been in a strong, confirmed uptrend on the Daily chart.
- Price Action: The price experiences a sharp, short-term decline (pullback) towards the rising 50-Period Moving Average (MA).
- Confirmation: You observe the price failing to close below the 50 MA. Instead, a large bullish candle with a long lower wick forms, showing aggressive buying pressure at the dynamic support level.
- Execution: You Buy at the close of the bullish confirmation candle. Your Stop Loss is placed tightly just below the 50 MA and the swing low. Your Take Profit targets the previous swing high, aiming for trend continuation.
- Rationale: The 50 MA acted as a strong technical magnet, confirming the move was a healthy retracement, not a reversal.
4.2 Scenario B: The Reversal Trade (The Double Top Break)
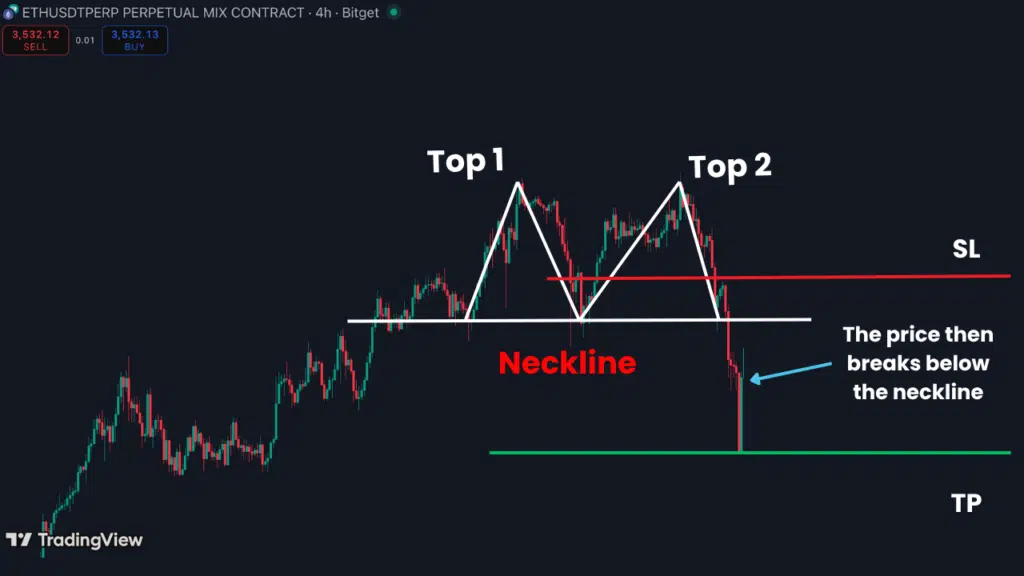
- Market Context: ETH/USDT market is trading at all-time highs after a sustained bullish run.
- Price Action: The price attempts to break a new high twice but fails, forming a Double Top pattern. Crucially, the price then breaks below the neckline (the low point between the two peaks) with heavy selling volume.
- Confirmation: The price breaks below the most recent major swing low, invalidating the higher-high, higher-low structure of the uptrend. Volume confirms the bearish shift.
- Execution: You sell on the first rally back up to retest the broken neckline/swing low (which now acts as new resistance). Your Stop Loss is placed above this new resistance. Your Take Profit targets a much lower, long-term support zone defined by earlier price action.
- Rationale: The failure to make a higher high, followed by the break of market structure and high volume, confirms a sustained trend reversal from bullish to bearish.
5. Exploiting Retracements With the Pullback Factor for TradingView:
Regardless of one’s subscribed trading notions and discipline, retracements have and will always be part of solid trends. Financial markets use these corrections to deliver prices efficiently.
Hence, it’s best to devise ways to leverage such corrections.
Trendlines, MAs, and the Fibonacci tool have proven considerably efficient. However, the Pullback Factor for TradingView is miles ahead of every strategy.
It is a volatility-based technical tool that recognizes and signals pullbacks from beginning to end. This grants users the opportunity to partake in the continuation move stress-free.
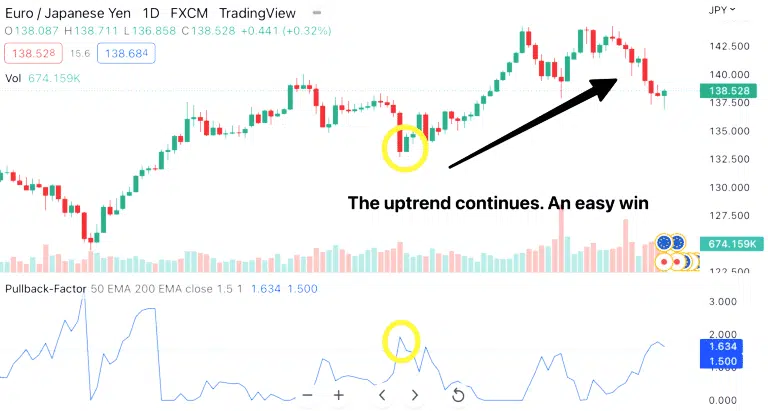
The Pullback Factor in action
Succinctly, here are some perks the indicator offers over other techniques:
- Assurance of high-probability setups during pullbacks
- Early awareness of fake retracements and potential reversals
- Ability to explore several markets, including stocks, indices, and futures
- Quickest trade entry and exits, thanks to timely alerts within and outside TradingView
Confirm these and many more benefits by clicking here.
6. Conclusion
Reversals and retracements signify a change in price direction. However, the former is more prolonged and significant than the latter, in which the market continues in its primary trend sooner or later.
Reversal trading strategies include reading fundamental data and anticipating chart patterns.
Similarly, pullback traders employ several recommended techniques to leverage retracements, like installing the Pullback Factor for TradingView.
Please share this article with friends, colleagues, and any ambitious retail trader. Also, remember to leave feedback in the ever-engaging Comment Section.


