Learn what a reversal pattern is, explore common bullish pattern and bearish pattern setups, and discover how Top Bottom Reversal helps traders improve reversal trading with earlier, clearer signals.
Table of Contents
1. Introduction
Every trader wants the same thing: to catch the turn before the crowd does.
That is why reversal trading has always been so attractive. If you can identify a strong reversal pattern early, you can enter near the top or bottom of a move instead of chasing price after the market has already taken off.
The problem is that most traders rely on the same old tools and the same obvious setups. By the time those signals appear, the market has often already moved.
In this guide, you will learn what a reversal pattern is, the main types traders use, some of the most popular bullish pattern and bearish pattern structures, and a less common approach called Top Bottom Reversal that helps traders spot reversals with better timing.
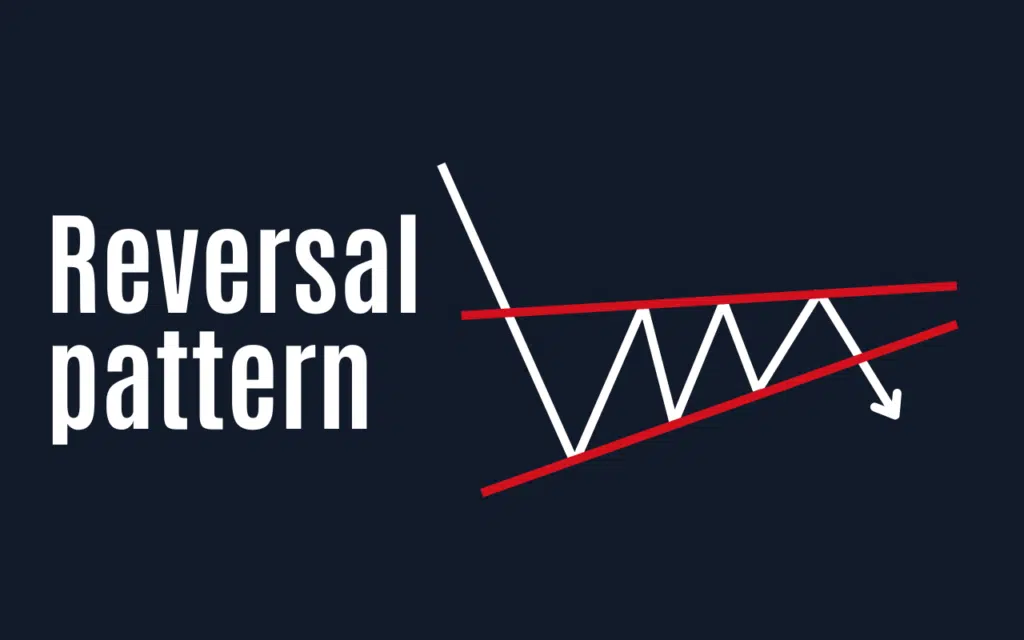
2. What is a reversal pattern?
A reversal pattern is a price structure or signal that suggests the current trend is weakening and may soon change direction.
In simple terms, it tells you the market may be preparing to shift from bullish to bearish, or from bearish to bullish.
This is what makes reversal trading so powerful. Instead of entering after the market has already confirmed a full new trend, traders use a bullish pattern or bearish pattern to anticipate the change early.
A bullish reversal pattern appears after a decline and suggests the market may start moving higher.
A bearish reversal pattern appears after a rally and suggests the market may start moving lower.
Of course, not every reversal pattern leads to a real turn. That is why traders often combine pattern recognition with confirmation tools and risk management.
3. Categories of reversal patterns
3.1. Chart-based reversal patterns
Chart-based reversal patterns are larger price structures that form over multiple candles or bars. These patterns usually reflect a shift in market psychology over time.
They are popular because they are easy to recognize visually and can appear in all markets and timeframes. Common examples include the Double Top, Double Bottom, Triple Top, Triple Bottom, and Head and Shoulders.
These setups are often used in reversal trading because they show the market failing to continue in the original direction.
3.2. Candlestick reversal patterns
Candlestick reversal patterns focus more on the shape and behavior of individual candles or small candle groups.
They are useful for spotting short-term hesitation, rejection, or sudden change in control between buyers and sellers.
Examples include doji candles, spinning tops, engulfing candles, hammers, and shooting stars. A candlestick-based bullish pattern can signal that sellers are losing control. A candlestick-based bearish pattern can signal that buyers are running out of strength.
Many traders combine chart patterns and candlestick patterns to improve accuracy.
4. Some of the most common reversal patterns
Before looking at newer methods, it helps to understand the classic reversal setups most traders already know.
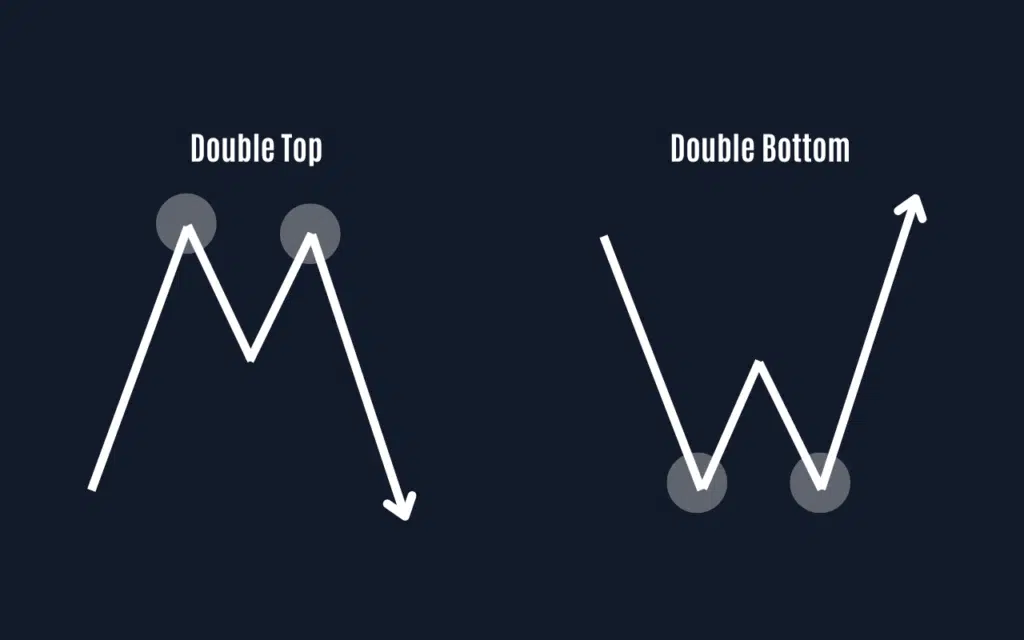
4.1. Double Top
The double top is a bearish pattern that forms after an uptrend.
Price pushes into a high, pulls back, then rallies again to a similar high but fails to continue upward. This suggests buyers are struggling to break resistance and momentum may be fading.
Once price breaks below the neckline, many traders see that as confirmation of a bearish reversal.
4.2. Double bottom
The double bottom is a bullish pattern that forms after a downtrend.
Price falls to a low, bounces, then drops again to a similar level before turning higher. This shows that sellers are failing to push price lower, and buyers may be stepping in. When price breaks above the necklines, traders often treat it as a bullish reversal signal.
4.3. Triple tops and bottoms
Triple tops and triple bottoms work in a similar way, but instead of two tests, the market makes three.
A triple top is usually a bearish pattern that shows repeated failure near resistance. A triple bottom is usually a bullish pattern that shows repeated failure near support.
These patterns can be powerful because the repeated tests make the level more obvious, but that also means many traders are watching the same setup.
4.4. Head and shoulder
The head and shoulders pattern is one of the best-known reversal patterns in trading.
A standard head and shoulders is a bearish pattern that forms after an uptrend. It consists of three peaks: a left shoulder, a higher head, and a right shoulder. The failure to make a stronger new high suggests the uptrend is weakening.
The inverted version is a bullish pattern that forms after a downtrend and signals a potential move higher.
This pattern remains a classic, but like many common setups, it is often traded by everyone using the same logic.

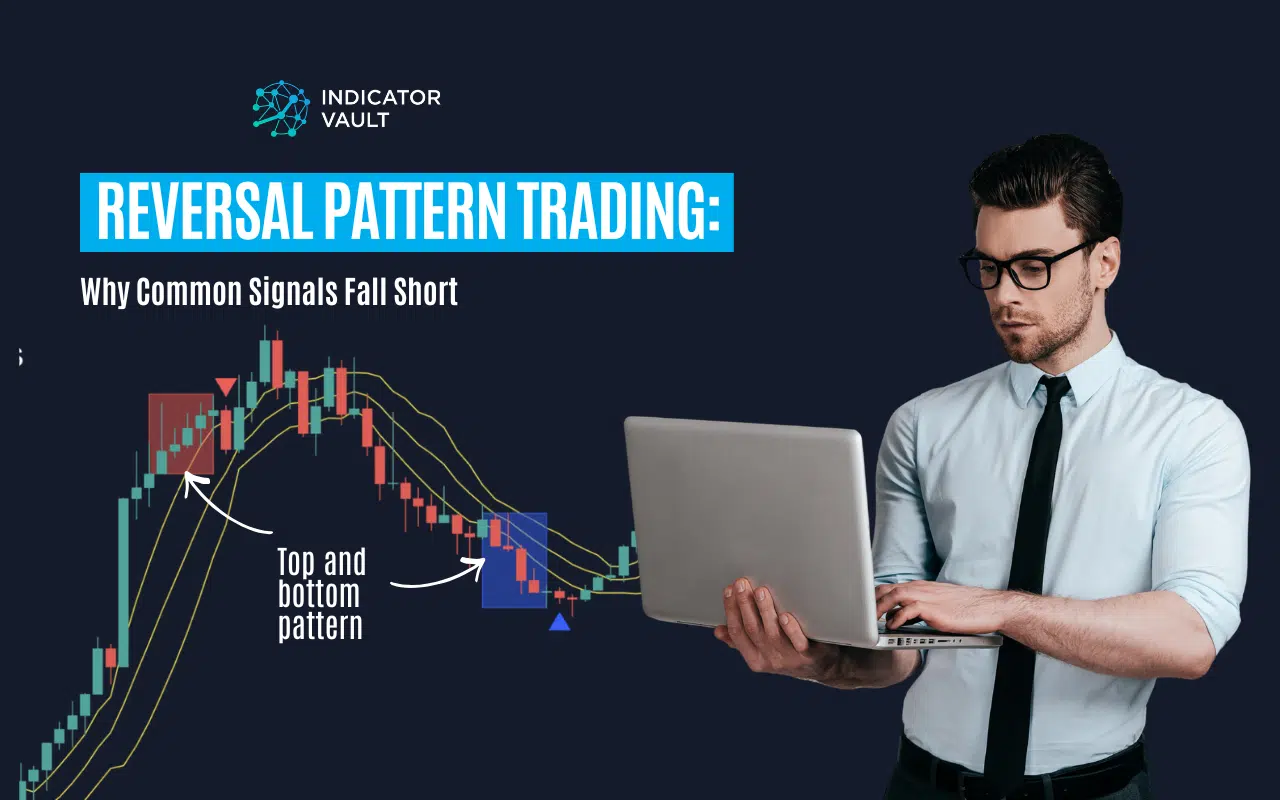
Most traders build their reversal trading around tools like RSI, MACD, or Bollinger Bands. These indicators can be useful, but on their own, they often do not give enough context to identify a high-quality reversal setup.
This creates two common problems. First, the signals are often late. By the time a reversal is confirmed, price may already have moved enough to reduce the reward. Second, the signals can be too broad. An oversold RSI or a Bollinger Bands touch does not always mean the market is truly ready to turn.
That is why reversal trading often requires more than one common signal. Traders usually need a more specific framework that can show when reversal pressure is actually building.
5. Start catching reversals before they happen with Top Bottom Reversal
If you want a smarter way to spot turning points, Top Bottom Reversal offers a different approach. Instead of relying on one common indicator alone, it combines multiple conditions into one unique reversal pattern to help identify high-probability setups earlier.

5.1. A unique pattern that spots reversals early
The Top Bottom Reversal indicator is built around a three-part logic designed to detect potential tops and bottoms before the move becomes obvious.

This pattern includes:
- Extreme RSI conditions
- A Bollinger Bands breakout
- An indecision candlestick after a sustained move
That combination creates a more selective signal.
For a potential top, the market may stretch upward, push into an extreme zone, and then show hesitation. That hesitation can form a bearish pattern suggesting buyers are losing control.
For a potential bottom, the market may sell off into an extreme zone and then print a reversal-style candle. That creates a bullish pattern suggesting selling pressure is fading.
This is what makes Top Bottom Reversal stand out. It does not depend on one isolated signal. It looks for a specific market condition where reversal pressure is building
5.2. Your exclusive key to consistent reversal trading
The reason many traders struggle with reversal trading is not because reversals do not work.
It is because they trade low-quality reversals.
Top Bottom Reversal helps filter our weaker setups by looking for a more complete pattern. When the conditions align, traders get a clearer signal that the market may be reaching an exhaustion point.

The indicator also helps by providing:
- Real-time reversal signals
- Automatic stop loss and take profit levels
- Alerts when new setups appear
- Support for all markets and timeframes
That means you are not just spotting a reversal. You are getting a more practical framework for actually trading it.
5.3. Master your brand-new reversal pattern with simple, actionable steps
Using Top Bottom Reversal is straightforward.
First, wait for the full pattern to appear. The indicator is designed to identify the setup for you, so you do not have to manually piece together every condition.

Second, review the trade idea and use the provided levels for entries, stop loss, and profit targets.
Third, wait for alerts so you do not need to stare at the chart all day.
This makes the whole process easier, especially for traders who want a more structured way to handle bullish pattern and bearish pattern entries without relying on guesswork.
6. The bottom line
A good reversal pattern can help you catch turning points before the crowd reacts.
Classic setups like the Double top, Double bottom, Triple Tops and Bottoms, and Head and Shoulders still matter. They are useful foundations for understanding how reversals form.
But if you want to go beyond the same common tools everyone else is using, Top Bottom Reversal offers a more unique approach to reversal trading.
By combining RSI extremes, Bollinger Bands breakouts, and indecision candlesticks into one structured setup, it helps traders find earlier, cleaner reversal opportunities through both bullish pattern and bearish pattern signals.
If you are serious about spotting tops and bottoms with more confidence, Top Bottom Reversal may be the reversal tool worth adding to your chart.