New to trading? Understand 10 fundamental trading terms with real examples and risk management tips.
Table of Contents
It’s easy to get discouraged or carried away with the complexities of trading. The discipline continues to become more multifaceted due to fast-rising participation. Fortunately, learning the trading terms is arguably the most vital step in the study journey.
Understanding trading terminology isn’t just about memorizing definitions – it’s about building the foundation for informed decision-making. Each term represents a critical concept that directly impacts your ability to analyze markets, manage risk, and execute profitable trades.
1. Financial Market
A financial market (or simply, market) is where traders buy and sell financial securities and derivatives.
A few of the most popular ones include:
- Stock market, featuring stocks (equities) as the primary instruments
- Foreign exchange (forex) market with currency pairs and currency futures
- Bond market for exchanging bonds (government or corporate)
- Commodities market that allows trading of physical commodities, like gold and silver
- Cryptocurrency market where cryptocurrencies, including Bitcoin and Ripple, change ownership
Basically, every trading action as a financial trader directly or indirectly happens in the markets.

Each market has unique characteristics: stocks offer company ownership, forex provides 24/5 trading access, commodities hedge against inflation, and cryptocurrencies deliver high volatility. Understanding which market aligns with your risk tolerance and trading style is crucial before investing capital.
Common beginner mistake: Trying to trade all markets simultaneously without mastering one first. Focus on a single market until you’re consistently profitable.
2. Time Frame
A time frame in trading refers to the period in a chart that a trader analyzes the market. It can vary from a few seconds to months, depending on the trading platform.
For example, TradingView charts provide time frames in ticks, seconds, days, months, and ranges.
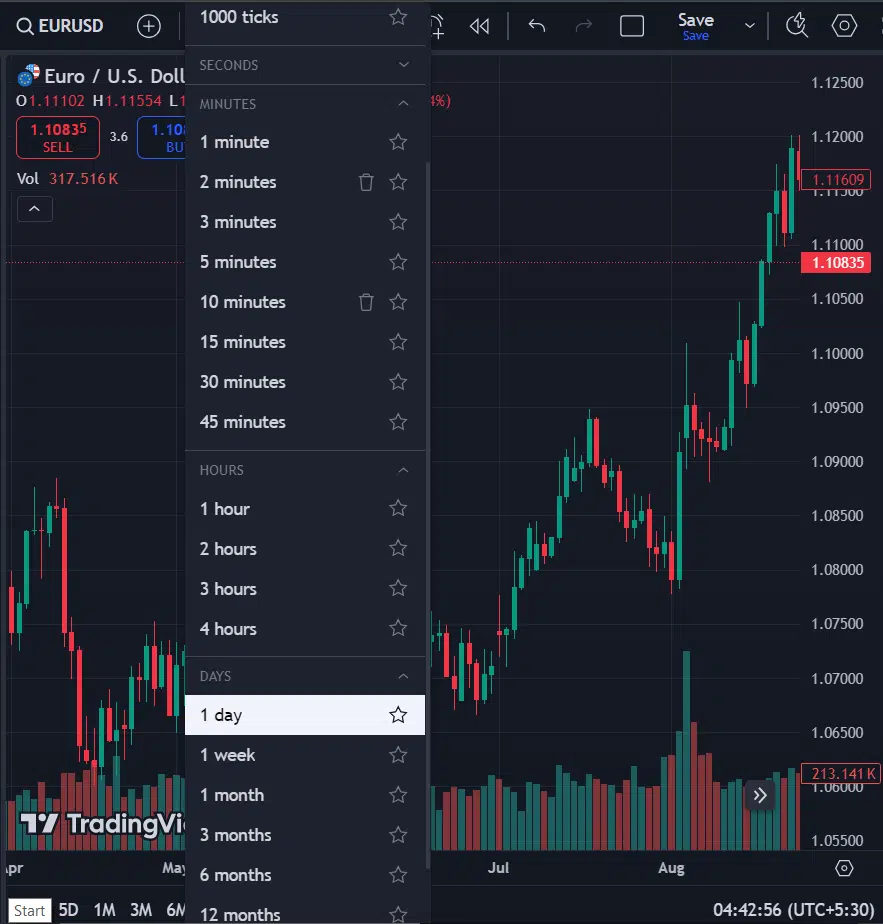
Different trading styles require different time frames:
- Scalpers: 1-minute to 5-minute charts
- Day traders: 5-minute to 1-hour charts
- Swing traders: 4-hour to daily charts
- Position traders: Daily to weekly charts
Proper time frame selection is one of the most crucial actions every beginner must take.
Pro tip: Always analyze higher time frames (daily/weekly) to understand the broader trend before trading on lower time frames. This multi-timeframe analysis prevents trading against the dominant market direction.
3. Leverage
Leverage is an action that involves trading with borrowed funds to increase the potential returns. It allows traders to use much more money than they invested.
Although it’s beneficial to trade with a significantly increased amount, leveraging magnifies losses. Hence, traders must be careful with it.
The deposit demanded for leveraging is termed margin, and its comparison with the total amount is the leverage ratio.
For example, with 10:1 leverage, a $1,000 deposit allows you to control a $10,000 position. If the market moves 5% in your favor, you gain $500 (50% return on your capital). However, a 5% move against you also results in a $500 loss, wiping out half your account.
Common leverage ratios:
- Conservative: 2:1 to 5:1
- Moderate: 10:1 to 20:1
- Aggressive: 50:1 to 100:1 (high risk)
Warning: Most beginner traders fail because of excessive leverage. Start with low leverage (2:1 or 5:1) until you develop consistent profitability.
4. Currency Pair
Currency pairs are quotations of the relative value between two currencies in the forex market. Experts classify them as major, minor, and exotic based on the particular currency type they contain.
Some of the most common pairs include:
- EURUSD – Euro and US Dollar
- GBPUSD – Great Britain Pounds and US Dollars
- NZDJPY – New Zealand Dollar and Japanese Yen
- EURGBP – Euro and Great Britain Pounds
- USDPLN – US Dollars and Polish Zloty

In a currency pair like EUR/USD at 1.0850, the first currency (EUR) is the “base currency” and the second (USD) is the “quote currency.” The price tells you how much quote currency is needed to buy one unit of base currency—in this case, 1 euro costs 1.0850 US dollars.
- Major pairs (include USD): Most liquid, tightest spreads, best for beginners
- Minor pairs (no USD): Cross currencies like EUR/GBP, moderate liquidity
- Exotic pairs (emerging markets): Higher spreads, more volatile, higher risk
5. Bullish and Bearish
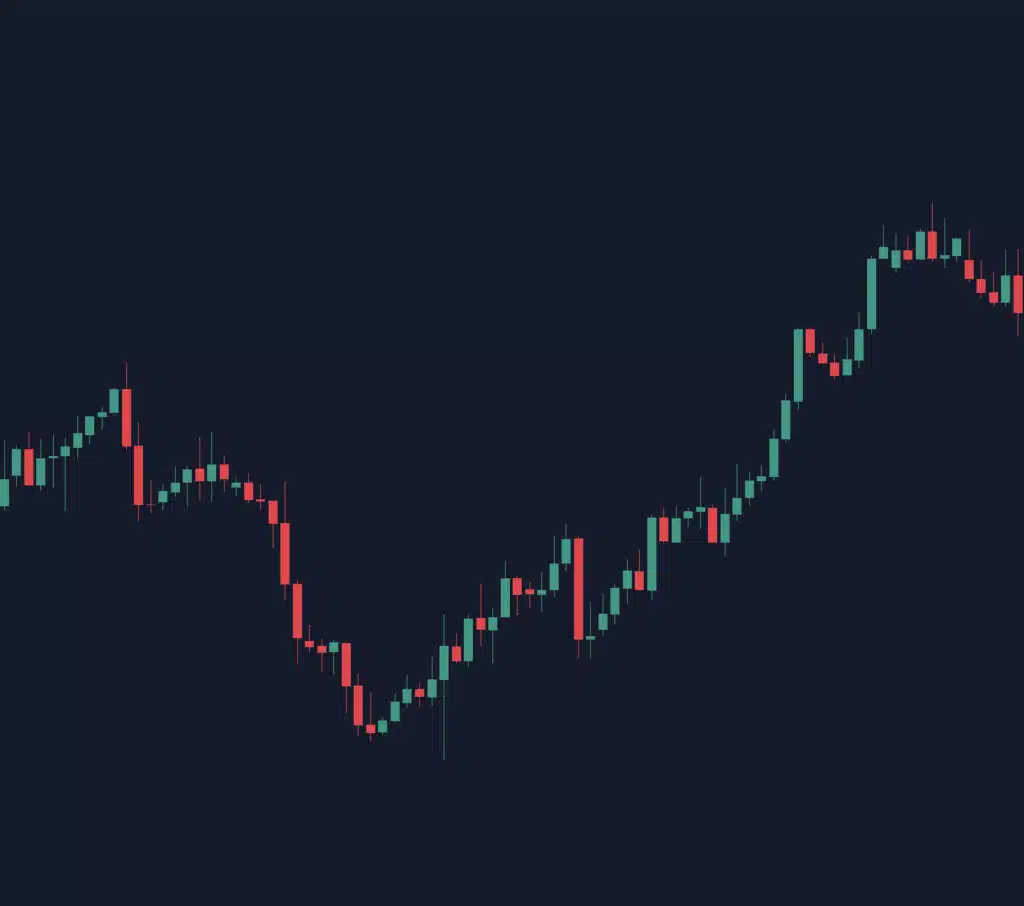
Bullish and bearish are popular terms that describe the expected market condition (trend) at any time. The former indicates the anticipation of higher prices, while the latter is lower.
Therefore, a bullish investor (or bull) is optimistic about a security’s price surge, while a bearish one (or bear) is hopeful for a price fall.
Both expectations can be beneficial depending on one’s strategy.
The terms originate from how these animals attack: bulls thrust their horns upward, while bears swipe their paws downward. This imagery helps traders remember price direction.
Market conditions:
- Bull market: Extended period of rising prices (20%+ increase from lows)
- Bear market: Extended period of falling prices (20%+ decline from highs)
- Sideways/Range-bound market: Price moves horizontally without clear direction
Important: You can profit in both bullish and bearish markets. Bullish traders go long (buy), while bearish traders go short (sell). Successful traders adapt their strategy to current market conditions rather than fighting the trend.
6. Stop Loss and Take Profit
Stop loss and take profit are trading terms that describe risk management orders to prevent further losses or secure profits.
The stop loss order (stop order) closes an already-losing trade to prevent worsening and possible margin calls.
On the other hand, a take profit order secures profits already made to some extent from an open position by closing it automatically.
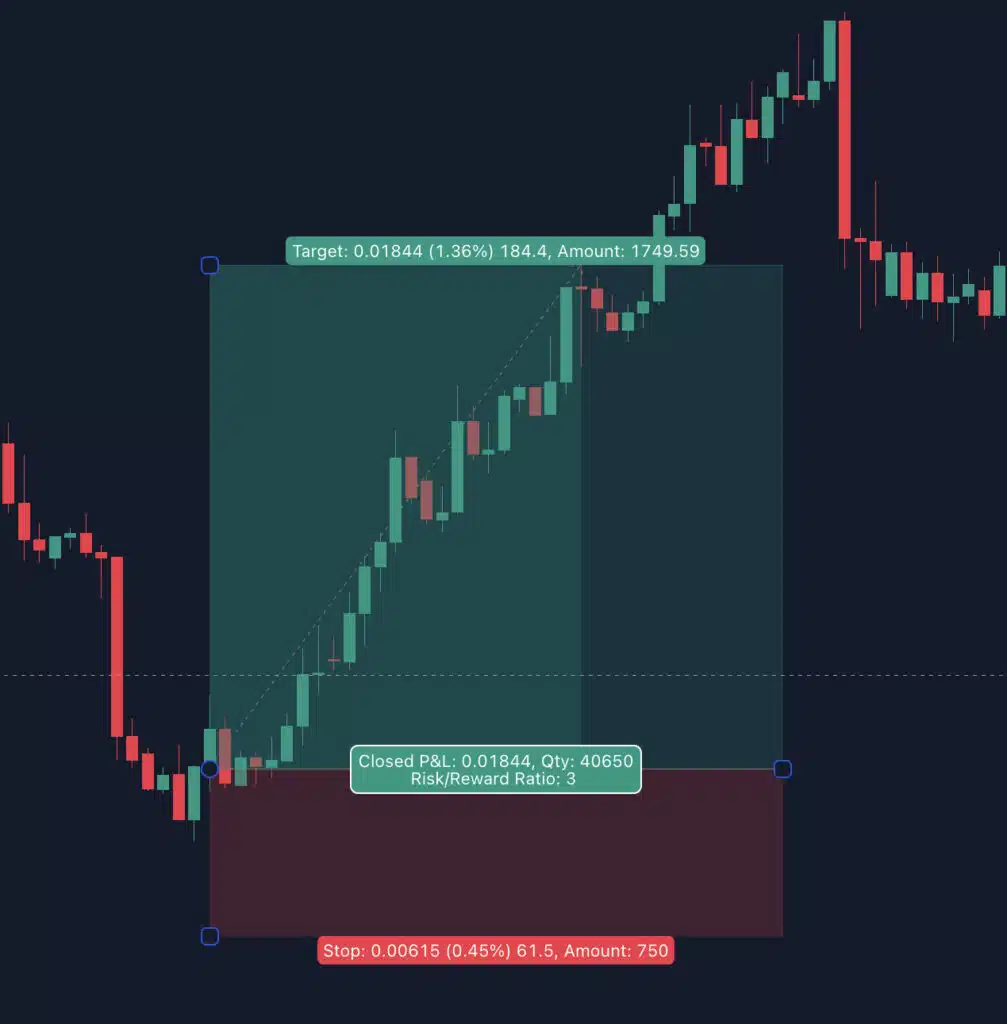
Real-world example: You buy a stock at $100. You set a stop loss at $95 (limiting your loss to $5 or 5%) and a take profit at $110 (securing $10 or 10% profit). These orders execute automatically without you monitoring the trade constantly.
The risk-reward ratio connects these two concepts: If your stop loss risks $50 and your take profit targets $150, you have a 1:3 risk-reward ratio. Professional traders typically aim for minimum 1:2 ratios, meaning they risk $1 to potentially make $2.
Critical rule: Never enter a trade without a predetermined stop loss. This is the #1 mistake that destroys beginner accounts. Emotional decision-making during losses leads to catastrophic account drawdowns.
7. Short Selling
Short selling (or going short) involves selling an asset (after borrowing) to repurchase it at a lower price. It allows traders to earn from a downtrend (bearish trend).
In CFDs, where there is no ownership of the underlying asset, only the difference between the trade’s entry and exit points matters.
A short trade can be profitable if the market falls after the sale. Conversely, it results in a loss when the price rises.
Step-by-step short selling process:
- You believe Stock XYZ will fall from $50
- You borrow 100 shares and sell them immediately for $5,000
- Stock drops to $40
- You buy back 100 shares for $4,000
- Return borrowed shares and keep $1,000 profit (minus fees)
Important distinction: In traditional markets, you must borrow the asset. In CFD and forex trading, you simply click “sell” and profit from price differences without actual ownership.
Risk warning: Short selling has unlimited loss potential. While losses on long positions are capped at your investment (price can’t go below $0), short selling losses are theoretically unlimited because prices can rise indefinitely.
8. Going Long
Going long is the opposite of short-selling, as traders expect higher prices soon.
It is a straightforward procedure relatable to the mainstream trading idea of buying low and selling high for profit.
If the interested markets rise eventually, long traders profit off their positions.
Traders can go long on any security or derivative across every financial market but must prepare for possible losses.
Example scenario: You go long on gold at $2,000 per ounce with a $5,000 position (2.5 ounces). Gold rises to $2,100 (+5%). Your position is now worth $5,250, netting you $250 profit. If gold falls to $1,900 (-5%), you lose $250.
Long vs. Short comparison:
- Long positions: Profit from rising prices, limited risk (max loss = investment), can hold indefinitely
- Short positions: Profit from falling prices, unlimited risk, may incur borrowing costs
Most beginner traders find going long more intuitive because it matches everyday buying behavior. However, successful traders must be comfortable profiting in both directions to capitalize on all market conditions.
9. Pip (Percentage in Point)
A pip is the smallest price increment in forex trading, representing one unit of change in the fourth decimal place for most currency pairs (0.0001). For yen pairs, a pip is the second decimal place (0.01).
Examples:
- EUR/USD moves from 1.0850 to 1.0851 = 1 pip increase
- USD/JPY moves from 149.50 to 149.51 = 1 pip increase
- GBP/USD moves from 1.2500 to 1.2550 = 50 pips increase
Pip value calculation: The monetary value of a pip depends on position size (lot size):
- Standard lot (100,000 units): 1 pip ≈ $10 for most USD pairs
- Mini lot (10,000 units): 1 pip ≈ $1
- Micro lot (1,000 units): 1 pip ≈ $0.10
Why pips matter: They standardize profit/loss communication across different currency pairs and account sizes. When someone says “I made 50 pips today,” other traders immediately understand the trade’s success relative to their position size.
Fractional pips (pipettes): Many brokers now quote prices to five decimal places (0.00001), with the fifth decimal called a pipette or fractional pip. This provides more precise pricing, especially beneficial for large institutional orders.
10. Volatility
Volatility measures the rate and magnitude of price fluctuations in a market over time. High volatility means rapid, large price swings; low volatility indicates stable, gradual movements.
Understanding volatility is crucial because it directly affects:
- Risk exposure: Higher volatility = larger potential gains AND losses
- Stop loss placement: Volatile markets require wider stops to avoid premature exits
- Trading strategy: Some strategies thrive in volatility (breakout trading), while others need stability (range trading)
- Psychological pressure: Wild price swings test emotional discipline
Volatility examples:
- Low volatility: EUR/USD moving 30-50 pips daily
- High volatility: Bitcoin moving 5-10% in a single day
- Extreme volatility: Market crashes or major news events causing 20%+ moves
Common mistake: Trading the same position size regardless of volatility. Professional traders adjust position sizes inversely to volatility – larger positions in calm markets, smaller positions during turbulence – to maintain consistent risk exposure.
11. Defying the Odds With an Unbeatable Technical Tool for TradingView
The learning curve of a newbie trader can be considerably challenging without proper guidance. Every facet of the financial market demands meticulous attention.
Thus, traders need all the assistance possible to exploit the markets satisfactorily.
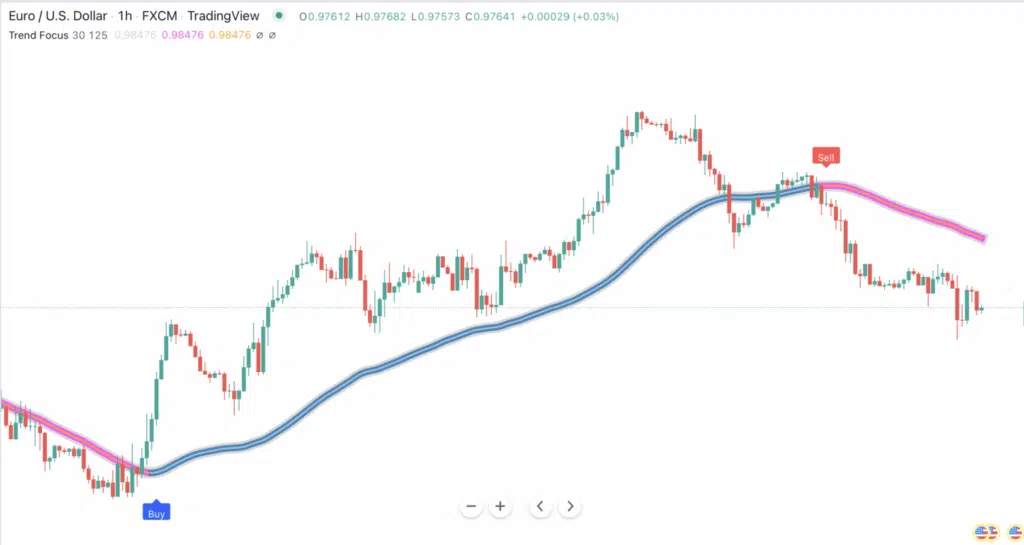
One of the most recommended options is Indicator Vault’s Trend Focus for TradingView.
The groundbreaking invention is an improvement to the traditional Moving Average, which lags among other significant flaws.
The Trend Focus avoids lags, doesn’t repaint, and reduces noise spectacularly to give every user an edge over the markets.
Below is a brief summary of the benefits every subscriber stands to gain from the indicator:
- Knowledge of the most promising trading opportunities in live conditions
- Awareness of fake price runs at the earliest times possible
- Liberty to explore any financial market, including stocks, cryptocurrency, commodities, etc.
- Flexibility to adopt any strategy due to the tool’s multifunctionality
- Assurance of taking every opportunity owing to the dependable trading alert system
Doubt these? Confirm more benefits with Trend Focus today.
12. Final Thoughts
The intricacies of trading may be too exciting or discouraging for first-timers. Therefore, it’s always advisable to take a systemized approach to the learning process.
A significant part of that involves understanding basic trading terms like those discussed above. It improves learners’ decision-making skills while building confidence and communication skills in related discussion circles.
Traders of all experience levels can also employ the highly recommended Trend Focus tool to improve one’s overall market performance.
Please share this article with every friend and acquaintance interested in trading, and remember to leave a comment below.