
Trade Ahead of the Crowd: Move Beyond Basic Moving Average Indicator
Moving averages are essential for identifying market trends, but traditional indicators lag and create false signals. Discover how the Trend Focus indicator filters our noise, spots real trend direction, and helps you trade with precision.
The moving average is one of the most widely used tools in technical analysis. It smooths out price data over a specific period, helping traders identify the overall direction of the market, whether it’s trending upward, downward, or moving sideways.
But here’s the catch: while moving averages are great for clarity, they often lag behind real-time price action. By the time a crossover confirms a trend, you’ve already missed a big part of the move.
That’s why understanding how moving averages work and improving them is key to smarter trading.
There are several types of moving averages, but the two most common are:
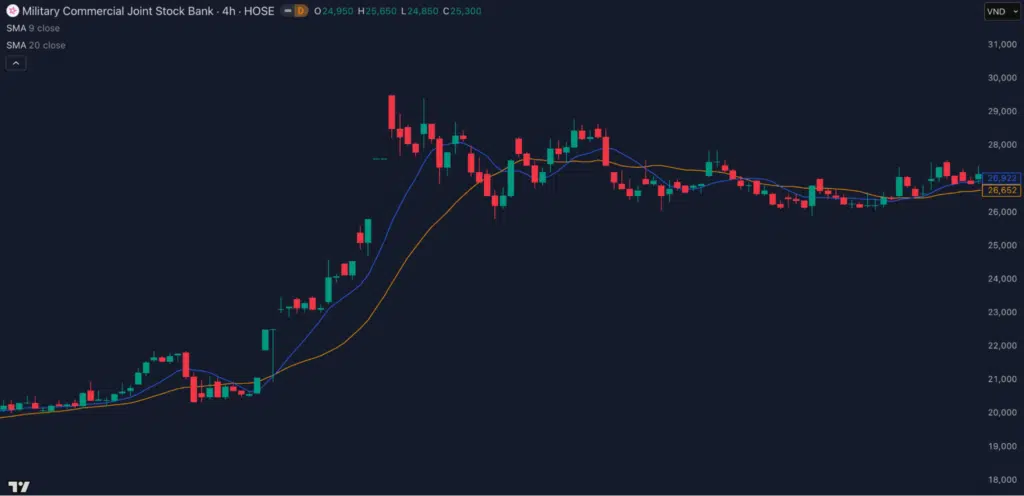
The SMA calculates the average closing price over a specific number of periods. For example, a 20-day SMA adds up the last 20 closing prices and divides by 20.
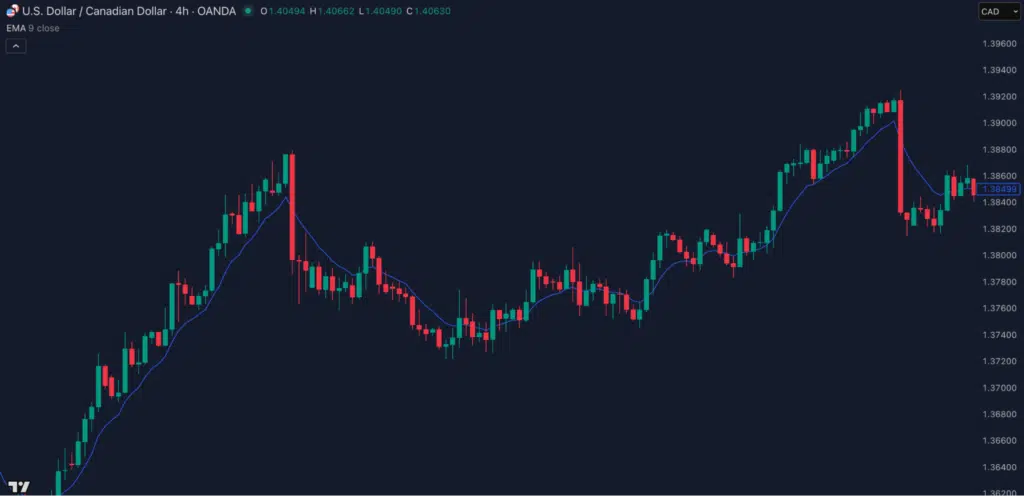
The EMA gives more weight to recent prices, making it more responsive to recent price changes. Traders often prefer the EMA for faster reaction to market movements.
Both SMAs and EMAs are valuable, but they come with trade-offs. SMAs are slow to react, while EMAs can overreact to short-term volatility.
So how do you strike the perfect balance between responsiveness and reliability?
In addition to the simple and exponential moving averages, traders also experiment with:
However, even the most advanced moving average indicators can produce false signals in choppy markets. That’s why many traders seek an alternative, something that captures the trend accurately while cutting out the noise.
Moving average helps traders:
A common method is using moving average crossovers, when a short-term average crosses above a long-term average, it signals a bullish trend. When it crosses below, it signals bearish momentum.
The problem? These signals often come too late. The market may have already shifted by the time the indicator reacts.
That’s where an advanced moving average indicator, one that’s faster, smarter, and adaptive, comes in.
This is where the Trend Focus indicator for Tradingview steps in.
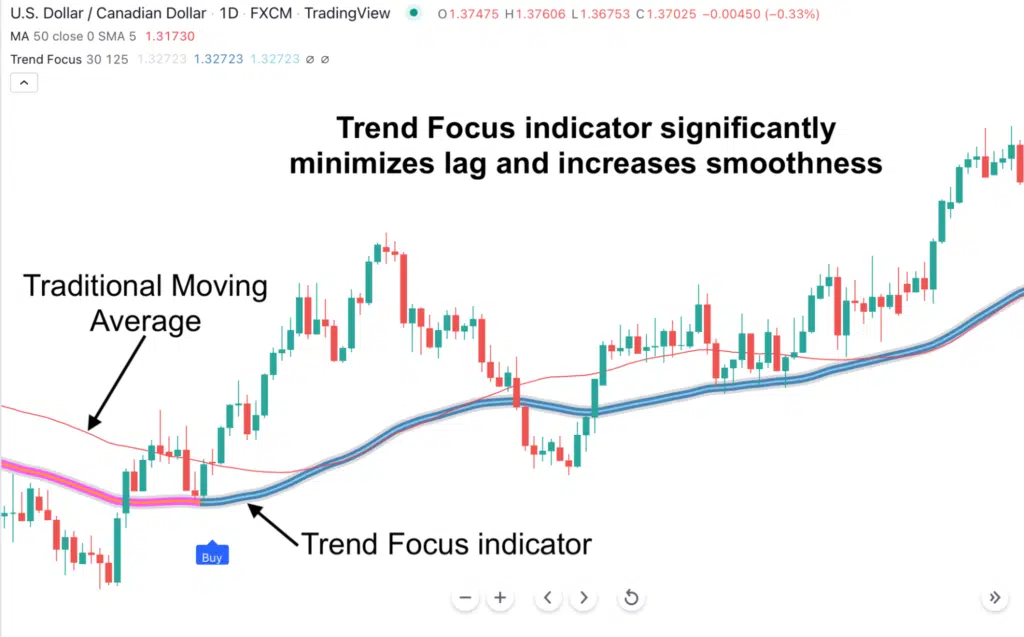
Trend Focus is built to overcome the biggest weakness of traditional moving averages, lag and noise.
By using a dynamic smoothing algorithm, Trend Focus reacts quickly to trend changes while filtering out meaningless price fluctuations. You’ll see only the real direction of the market, nothing more, nothing less.
With Trend Focus, you can:
Unlike the simple or exponential moving average, Trend Focus does not just follow price, it predicts it.
It helps you enter earlier, exit smarter, and stay aligned with the dominant market trend whether you’re scalping, day trading, or swing trading.
The moving average remains a cornerstone of technical analysis, but traditional methods leave too much room for delay and confusion.
If you want to cut through the noise, eliminate lag, and see trend direction clearly, the Trend Focus indicator is your edge.
It’s everything traders love about moving averages, just faster, sharper, and smarter.
Did you know that one of the most common investments today is stock trading? Knowing how to examine stocks beforehand can help you choose stocks with more confidence as a beginner trader and maximize your earnings. Technical analysis of stock trends is one form of stock analysis that you can utilize. This type of study…
Learn everything about divergence trading, including bullish divergence, bearish divergence, regular and hidden divergence, and how to trade momentum shifts effectively. Discover the limitations of traditional divergence tools, and how the Natural Divergence indicator solves them with early detection, smart filtering and automatic market scanning. Table of Contents 1. What is divergence trading? Divergence trading…

Volume in trading reveals the real strength behind price moves. Learn what volume is, how to use it in your strategy, and how the Volume Force Pro indicator helps predict trend changes, market tops, and bottoms with precision. Table of Contents 1. What is volume? When most traders stare at charts, they only see prices….
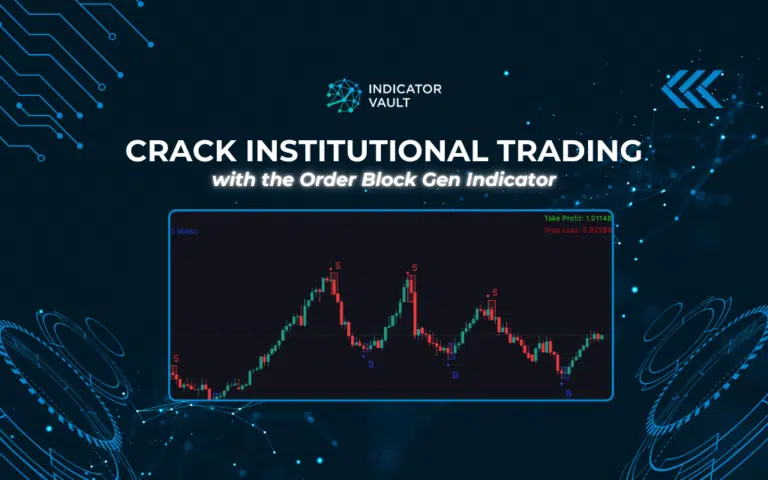
Table of Contents 1. What Are Order Blocks, and Why Do They Matter? Order blocks are powerful trading zones where institutional traders, such as banks or hedge funds, place significant buy or sell orders. These zones act as price magnets, creating critical support and resistance levels that drive large market movements. For retail traders, identifying…
Learn how to trade Wolfe Waves without the manual drawing headache. Discover the geometric sweet spot that predicts reversals and how to let Easy Wolfe Wave do the math for you. Table of Contents 1. Introduction A first look of bullish & bearish wolfe waves Most traders struggle because they treat the market like a…
Stop getting stopped out by pullbacks! Turn pullback nightmares into profit opportunities. Advanced algorithms reveal the exact moment when every retracement ends across all markets. Table of Contents 1. What Is a Market Pullback, and Why Do They Destroy Trading Accounts? A pullback is a temporary reversal within a larger trend, when price moves against…