
Learn the emotional truth behind divergence trading. This simple guide helps you identify real signals and avoid common traps, so you can finally stop guessing and start trading with confidence.
Table of Contents
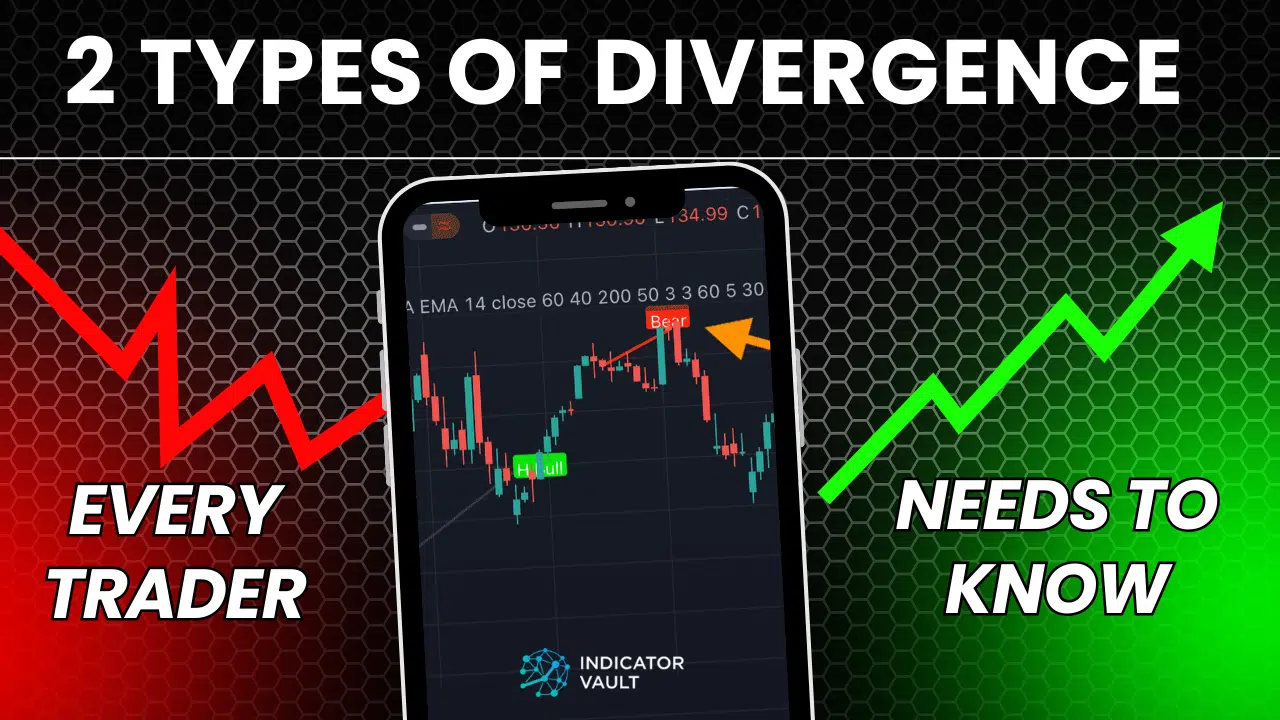
1. What is Divergence?
Divergence is a powerful trading signal that happens when the price of an asset and an indicator (like the RSI or MACD) are moving in opposite directions. It’s the market’s way of telling you that the current trend is weakening and a reversal might be coming.
Think of it like a car. The price is how fast the car is going, and the indicator is the engine’s power. If the car’s speed is increasing (making new highs) but the engine’s power is dropping (the indicator is making lower highs), that’s a sign the car is about to run out of gas.
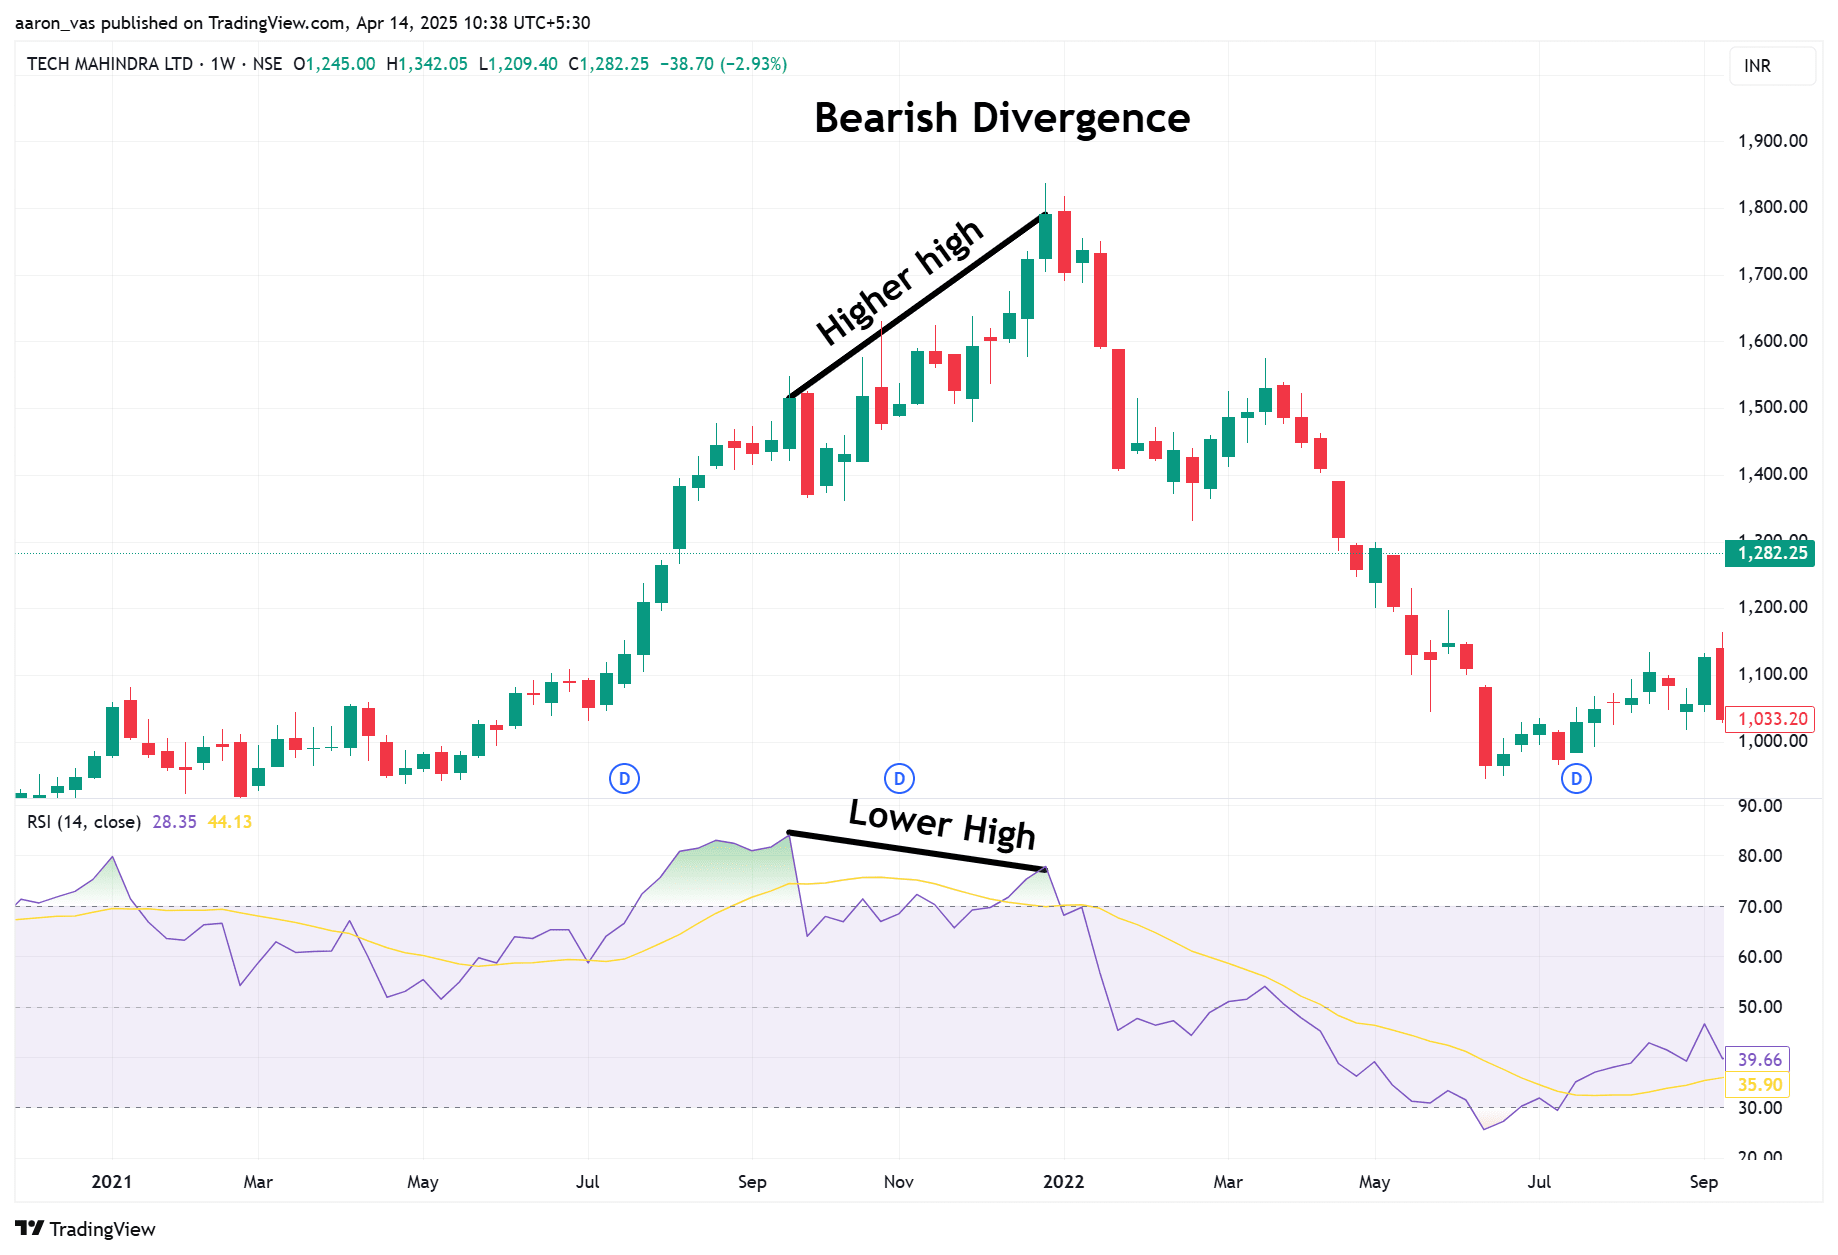
In the market, this is called bearish divergence, and it suggests a sell-off is near.
It happens when the price of an asset makes a higher high, but an indicator makes a lower high. This signals that the upward momentum is losing steam, even as the price continues to rise.
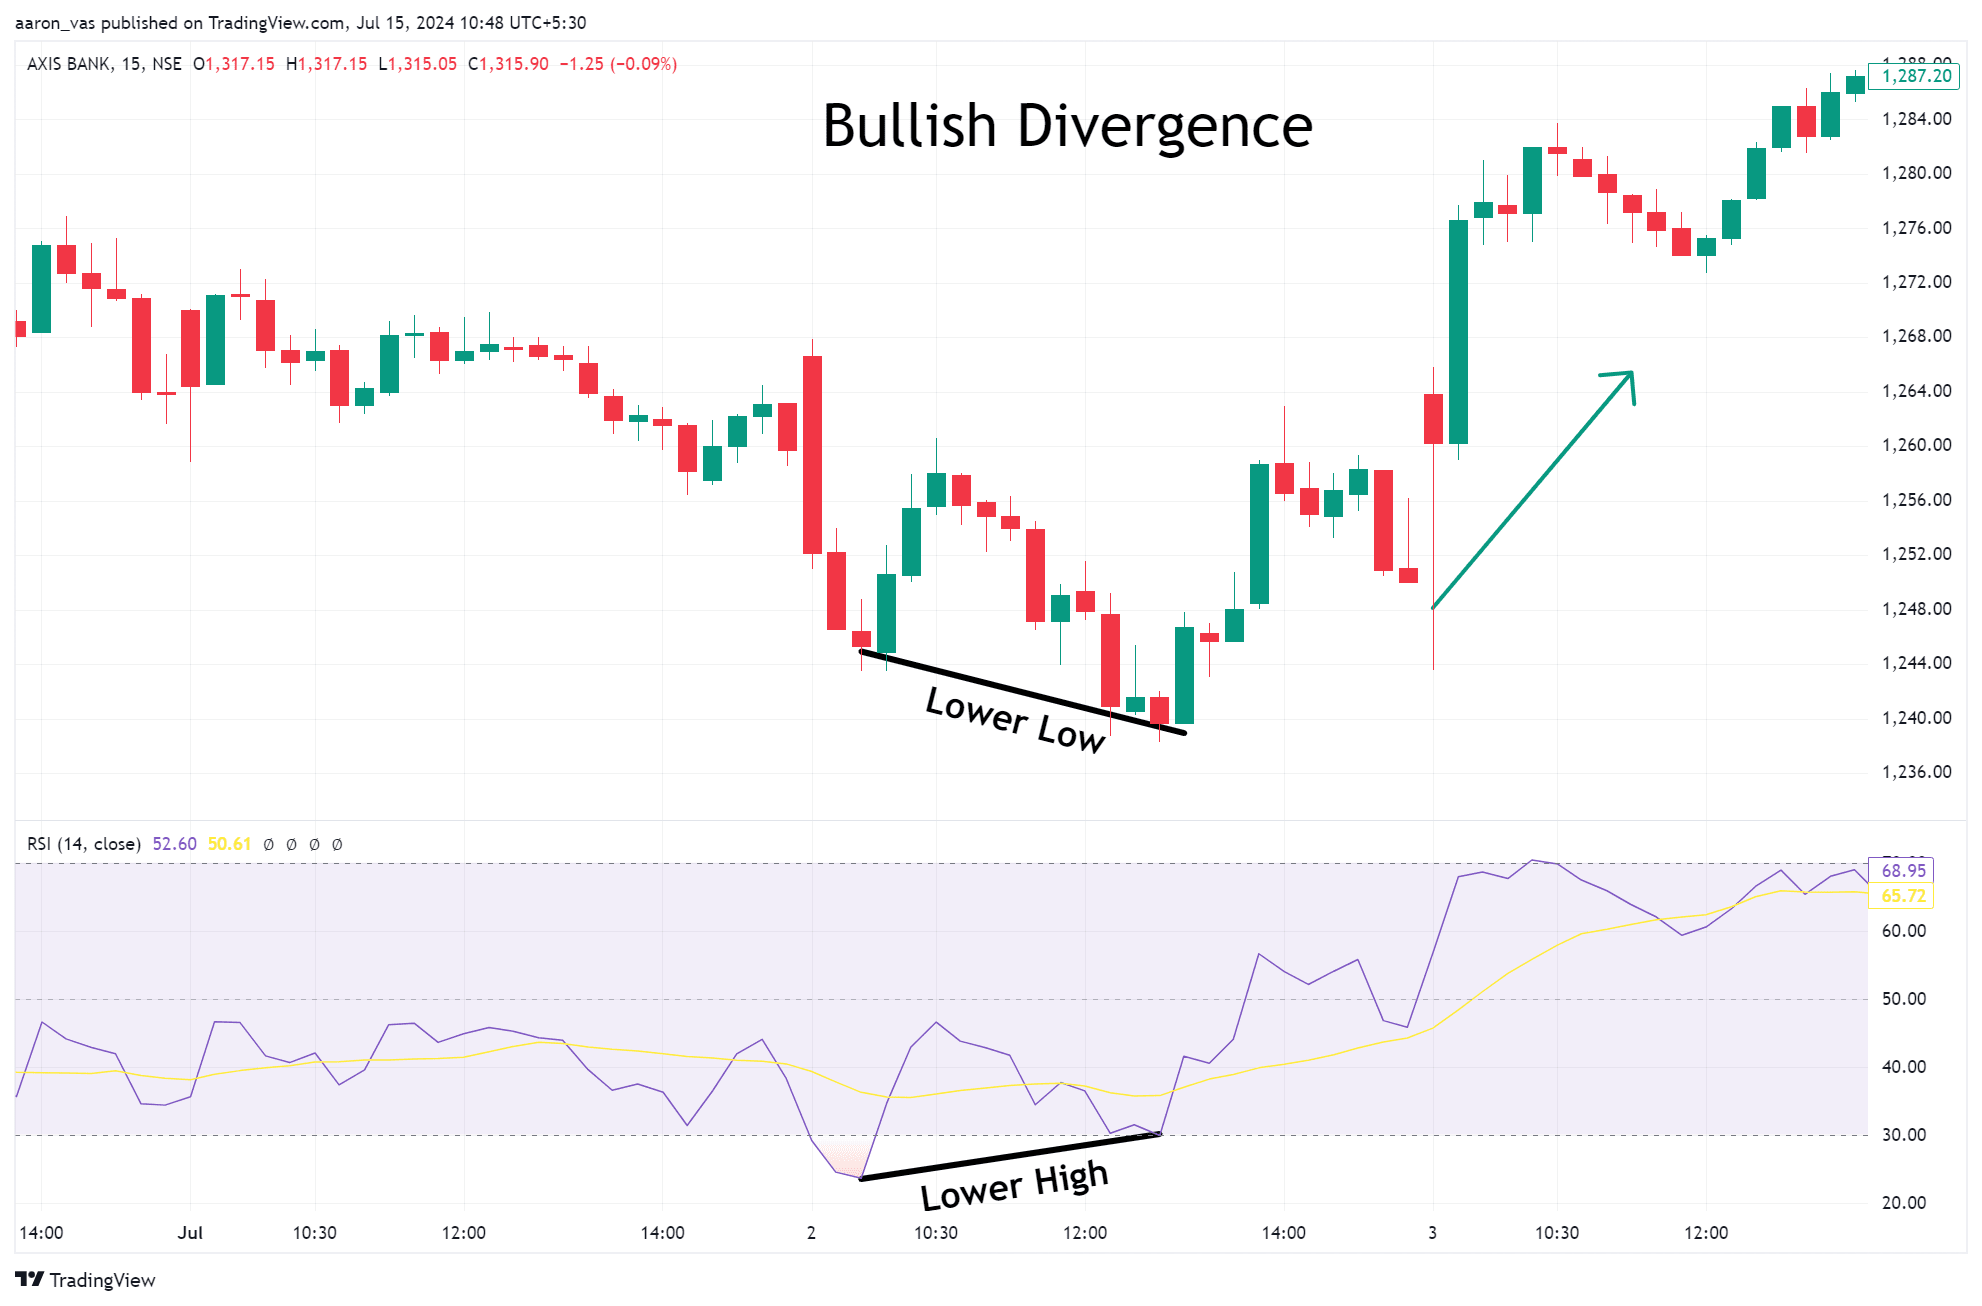
Conversely, if the price is making a new low but the engine’s power is increasing, that’s a sign the trend is reversing to the upside. This is bullish divergence, and it suggests a strong buy signal.
Bullish divergence occurs when the price of an asset makes a lower low, but an indicator (like the RSI or MACD) makes a higher low. This is often seen as a sign that the downward momentum is weakening, even though the price is still falling.
Think of it like a car driving downhill. The car is still moving down (lower low in price), but the driver is starting to hit the brakes (higher low in momentum). This suggests that the price might be getting ready to reverse and move higher.
2. An Example of Divergence in Action
Imagine the price of Bitcoin is dropping and hits a new low of $25,000. At the same time, the RSI indicator on your chart makes a higher low.
- Price: Goes down to a new low.
- RSI: Goes up, showing less downward momentum.
Because the price and the indicator are telling two different stories, this is a clear sign of bullish divergence. It indicates that the selling pressure is fading, and a reversal to the upside is likely.
Whatever the paired entity may be, a trader must extensively clarify their relationship.
Price-oscillator pairs typically connect directly, and relatively higher/lower swing highs/lows appear simultaneously (except during a divergence).
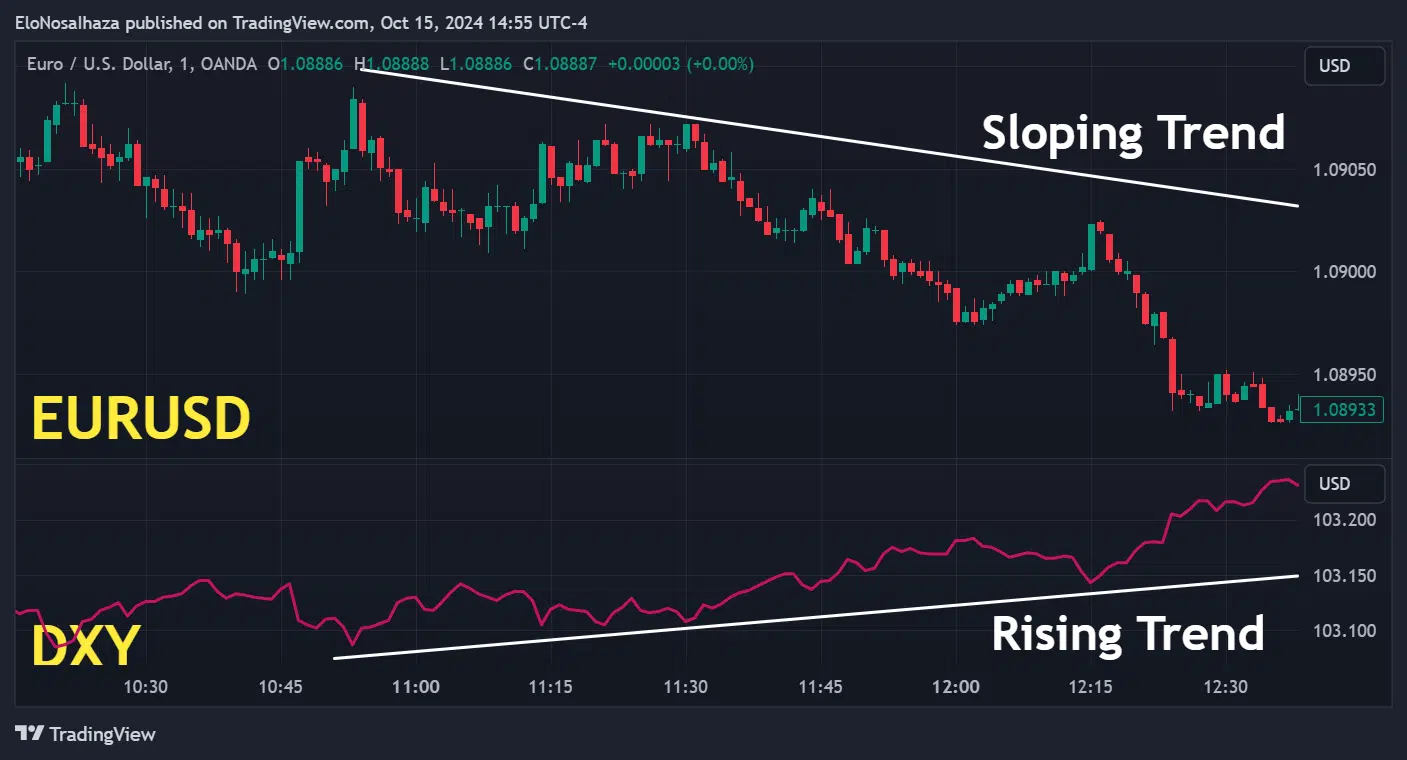
However, price-price relationships are not always direct.
For example, the U.S. Dollar Index (DXY) and the EUR/USD have an inverse relationship. That means a higher high on the index appears as a lower low on the forex pair (except during a divergence).
3. Why Divergence Trading Feels Different
Every trader knows the feeling. You’re staring at your charts, convinced you’ve found the perfect trade. The price is at a new high, and you’re ready to jump in, but then… it just doesn’t work.
The trade fails, and you’re left wondering why the market seemed to lie.
This is the emotional trap of trading. You’re reacting to what the market is doing, but you don’t know why.
The secret to moving past this emotional struggle is divergence.
This powerful tool reveals a conflict between price action and momentum, signaling that a major trend is about to reverse. It’s the market’s way of telling you a secret, but you have to know how to listen.
Divergence trading can be relatively straightforward, but every new trader must grasp the essential criteria for a trade opportunity.
Hence, pros recommend comprehensive backtesting and forward testing.
Usually, the main requirement in this strategy is the disharmony between relative swing highs or lows. The price may form a higher/lower one as the oscillator fails to replicate it.
However, identifying it in live conditions with other factors may prove challenging if not properly mastered.
4. The Clear Rules for Trading Divergence
Here are the simple rules to follow to find a trade with a high probability of success:
4.1. Use the Right Tools.
You can’t listen to the market’s secrets with the wrong tools. The most trusted indicators for divergence are the RSI and MACD. They help you confirm whether a move has the real power to continue or if it’s running out of steam.
4.2. Find the Conflict.
Divergence is all about a visual conflict between the price and your indicator.
For example, imagine TESLA’s stock price is rising and makes a new high at $250. But when you look at the RSI, it only reaches a lower high. This bearish divergence is a major warning. It’s a signal that buyers are losing strength, and a reversal might be coming soon, even though the price is still going up.
4.3. Confirm Your Signal.
A divergence signal is your first clue, not your entire trading plan. To avoid false signals, you must confirm your trade. Use other tools like candlestick patterns or chart patterns like a Double Top to ensure you’ve found a genuine reversal. This step takes the guesswork out of your entry and gives you the confidence to pull the trigger.
4.4. Know Your Market.
Divergence is a powerful tool, but it’s not a silver bullet. It’s a reversal strategy, which means it works best when the market is losing momentum, not when it’s in a strong, fast trend. By using it in the right market conditions, you’ll avoid getting run over by a one-sided market.
The classical chart and candlestick patterns have become the go-to methods for some.
Head & Shoulders, Double Top, and Double Bottom are examples of reversal chart patterns. Inverted Hammer, Shooting Star, and Evening Star are signaling candlestick shapes.
For risk management, various detailed strategies feature take profit and stop orders, position size calculations, and risk-to-reward ratio assessments.

5. Solution to easy divergences
Divergence trading can be one of the most dependable profitability techniques with an excellent oscillator. Hence, traders are pressured to make the perfect choice among the hundreds of options.
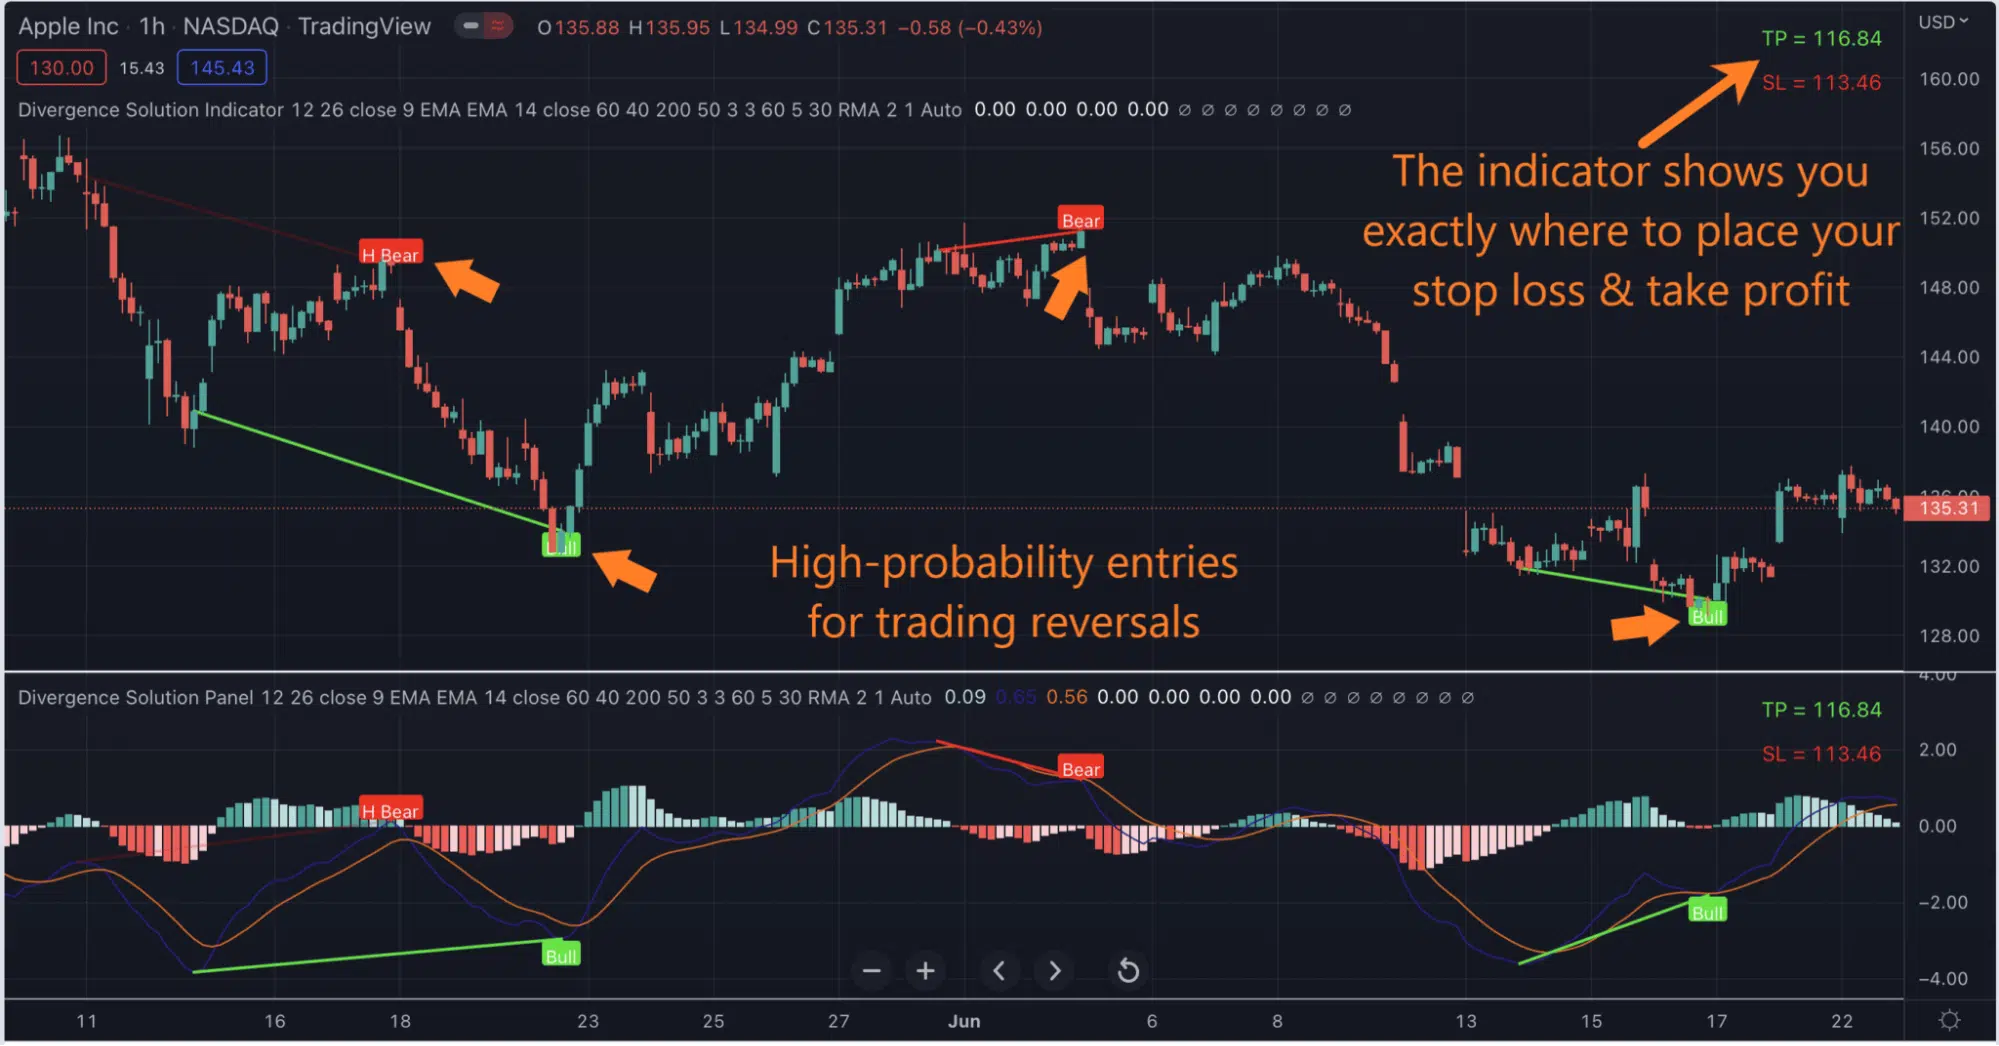
One of the leading lesser-known oscillators is the Divergence Solution for TradingView.
Its triple confirmation algorithm presents the best divergence opportunities in any market or time frame applied. Every user enjoys the near-automated trading solution due to its bonus application in risk management.
In short, here are some benefits of the groundbreaking indicator:
- Ability to spot divergences several moments before other traders with little to no effort
- Knowledge of the best risk management practices per trade
- Freedom to explore several financial markets
- Liberty to day trade, scalp, or position trade with ease
- Assurance of taking every opportunity, credit to the tool’s reliable alert system
Sounds unreal? Take your divergence trading to the next level by clicking here today! The results are mind-blowing.
6. Summary
Divergence trading is worth every time and effort to learn. Profitable subscribers to the theory believe the following tips will help every newbie find their feet:
- Discovery of reliable oscillators
- Clarification of the price-indicator or price-price relationships
- Establishment of a clear trading time frame
- Mastering what a perfect divergence signal looks like
- Utilization of more confluences for entries, exits, and risk management
- Abstinence from strongly trending markets
As for the oscillator choice, only a few come close to Indicator Vault’s Divergence Solution for TradingView. It improves traders’ experience in many ways comparable to an automated system.
Please share this post in every trading circle for increased insights into divergence trading. Also, leave a comment below for eye-opening tips from experts.


