
Stop fearing stock pullback. Discover 5 professional strategies to turn market dips from sources of anxiety into consistent profit opportunities.
Table of Contents
1. Stock Pullback Fundamentals
Why do most traders panic when stocks retreat from their highs, while professionals see these same moments as profit opportunities?
The answer lies in understanding stock pullback dynamics. A pullback represents a temporary move against the primary trend direction. In an uptrending stock, this means a temporary decline before potentially continuing higher. In a downtrending stock, a stock pullback would be a temporary bounce upward against the main downward trend.
Different traders use various terms for the same concepts, which can create confusion:
- In Uptrends: “Pullback,” “dip,” “retracement,” or “correction” all describe temporary declines
- In Downtrends: “Pullback,” “bounce,” “rally,” or “retracement” describe temporary upward moves against the bearish trend
For clarity in this guide, we focus primarily on stock pullback opportunities in uptrending stocks – temporary declines that offer buying opportunities. However, the same principles apply in reverse for downtrend pullbacks, where temporary bounces provide shorting opportunities.
By mastering stock pullback trading, you’ll transform market dips from sources of anxiety into consistent profit opportunities.
2. Understanding Stock Pullback Opportunities
Every strong stock pullback shares common characteristics that separate temporary retreats from genuine trend reversals. Professional traders look for specific conditions before committing capital to any stock pullback trade.
The ideal pullback occurs within a clearly established uptrend, where the stock temporarily retraces to test key support levels. During this process, buying interest typically emerges at predictable technical levels, creating favorable risk-reward scenarios for prepared traders.
Understanding these dynamics allows you to position yourself ahead of the crowd, entering stock pullback trades with confidence and clear exit strategies.
3. Five Proven Stock Pullback Trading Strategies
3.1 Moving Average Test Strategy
The moving average method stands as one of the most reliable approaches for stock pullback trading. This strategy capitalizes on the tendency for stocks to find support at key moving average levels during temporary declines.
Setup Requirements:
- Stock must be in a clear uptrend above its primary moving averages
- Pullback brings price down to test the moving average line
- Volume decreases during the pullback phase
- No significant fundamental news driving the decline
Entry Process: Begin monitoring when a pullback approaches the 20-day moving average for short-term trades or the 50-day moving average for longer-term positions. The key signal occurs when the stock touches but holds above the moving average level, especially when accompanied by increasing volume.
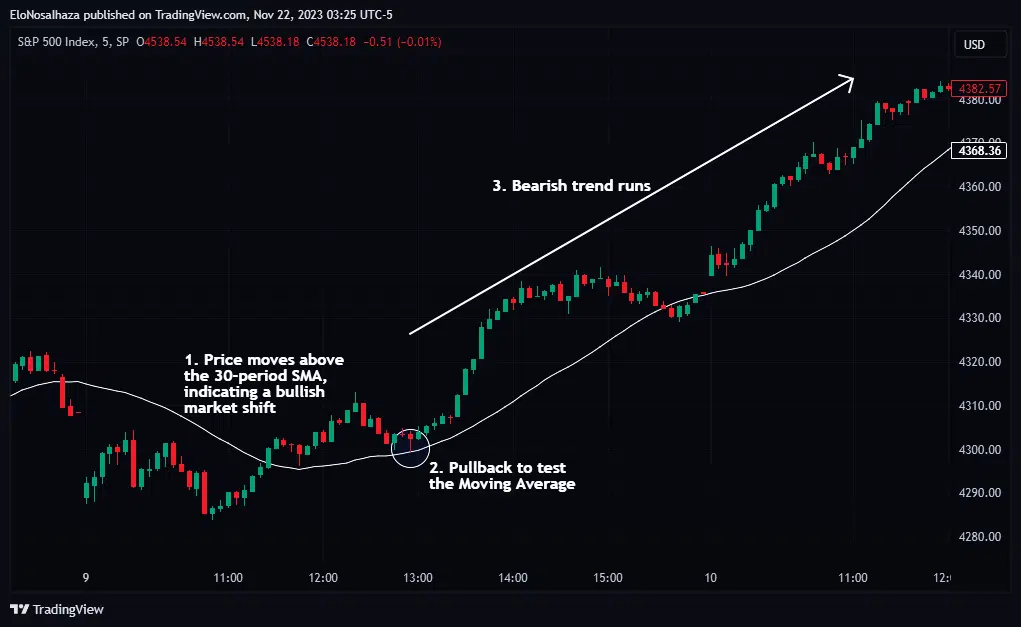
The above case scenario uses a 30-period Simple Moving Average (SMA) on a 5-minute chart.
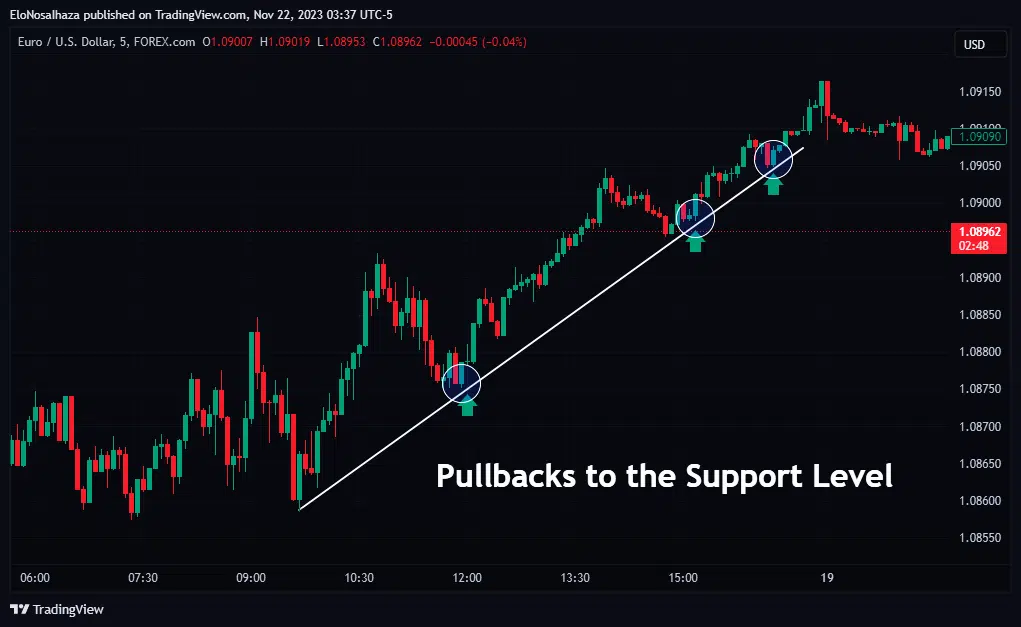
3.2 Trendline Support Strategy
Trendline analysis provides another powerful method for stock pullback trading. This approach uses diagonal support and resistance lines to identify optimal entry points during temporary stock declines.
Implementation Steps: Start by drawing trendlines connecting significant swing lows in an uptrending stock. These lines often act as dynamic support levels during pullback situations, providing clear reference points for trade entries.
Signal Confirmation: The strongest pullback signals occur when stocks bounce decisively from established trendlines. Look for strong bullish candlestick patterns at these levels, particularly when volume expands on the bounce day.
Multiple Touch Points: The most reliable trendlines show multiple touches over time. A pullback that tests a trendline for the third or fourth time often provides excellent risk-reward opportunities, as the level has proven its significance.
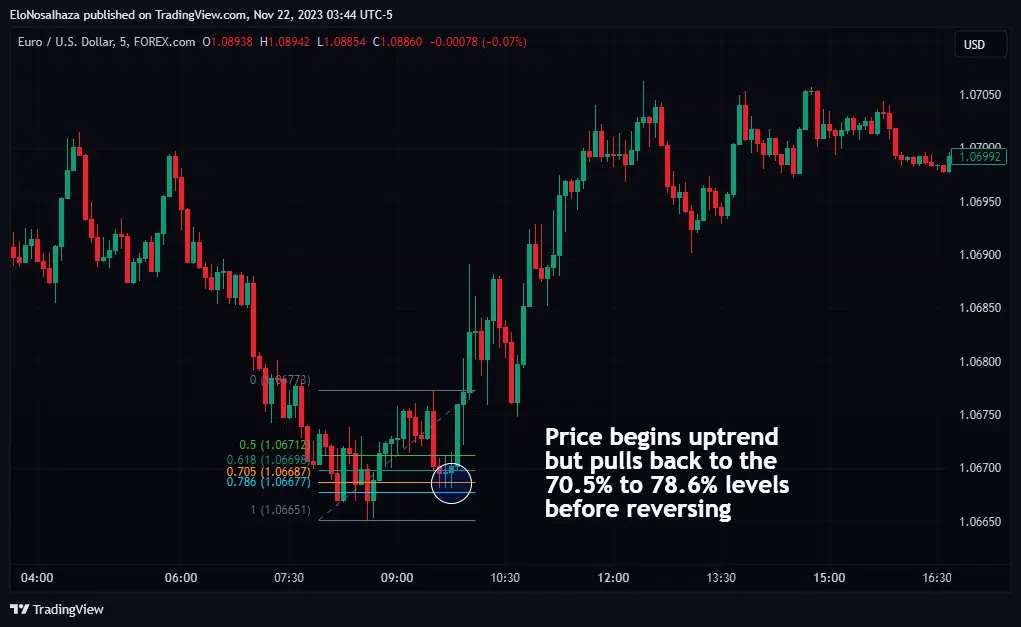
3.3 Fibonacci Retracement Method
Fibonacci retracements offer mathematical precision to stock pullback analysis. This tool helps identify specific price levels where stocks commonly find support during temporary declines.
Application Process: After identifying a significant upward move, apply Fibonacci retracements from the swing low to the swing high. The resulting levels often coincide with natural pullback support areas.
Key Retracement Levels: Most pullback trades focus on the 38.2 and 61.8 Fibonacci levels. These mathematical relationships frequently align with natural support zones, creating high-probability trade setups.
Confirmation Signals: Never trade Fibonacci levels in isolation. Combine retracement analysis with candlestick patterns, volume analysis, and momentum indicators to confirm pullback entry signals.
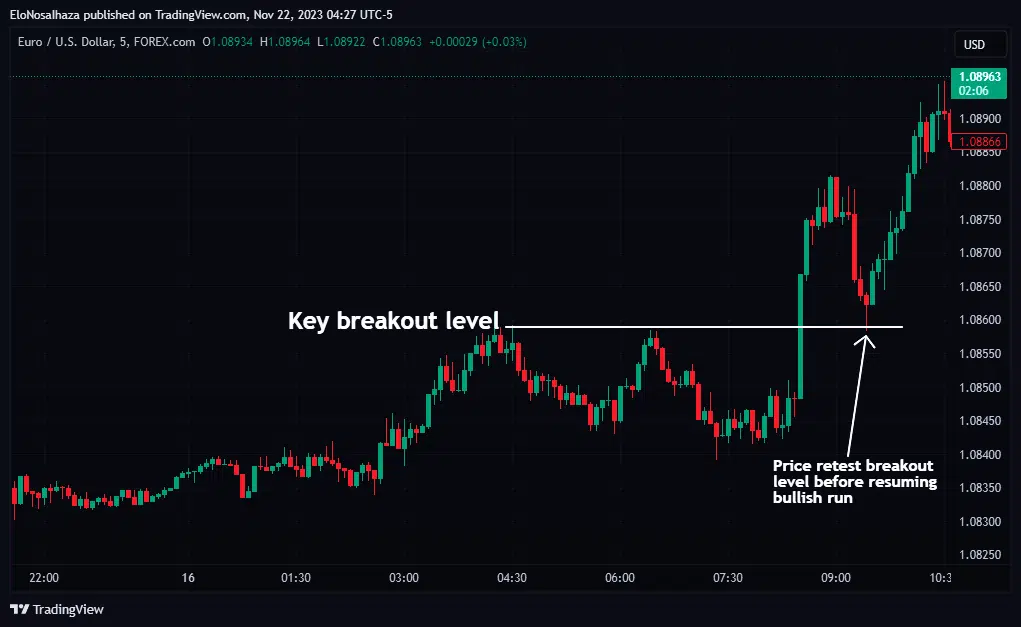
3.4 Breakout Pullback Technique
This stock pullback strategy capitalizes on the tendency for stocks to retest breakout levels after initial moves higher. These retests often provide second-chance entries into strong momentum plays.
Identifying Setups: Monitor stocks that have recently broken above significant resistance levels. The subsequent pullback to test the breakout area often creates optimal entry conditions for continuation moves.
Timing Considerations: Breakout pullback trades require precise timing. The strongest signals occur when stocks quickly return to test the breakout level without spending excessive time in consolidation.
Volume Analysis: Pay close attention to volume patterns during breakout pullback situations. The initial breakout should show high volume, while the pullback phase typically shows lighter volume, followed by expansion on the bounce.
3.5 Divergence Strategy
Divergence-based stock pullback trading involves analyzing the relationship between price action and momentum indicators. This advanced technique helps identify when apparent weakness actually masks underlying strength.
Price-Indicator Divergence: Monitor situations where a pullback creates lower lows in price while momentum indicators like RSI or MACD form higher lows. This divergence often signals impending trend continuation.
Confirmation Requirements: Divergence signals gain reliability when combined with other technical factors. Look for divergence at key support levels or in conjunction with oversold momentum readings.
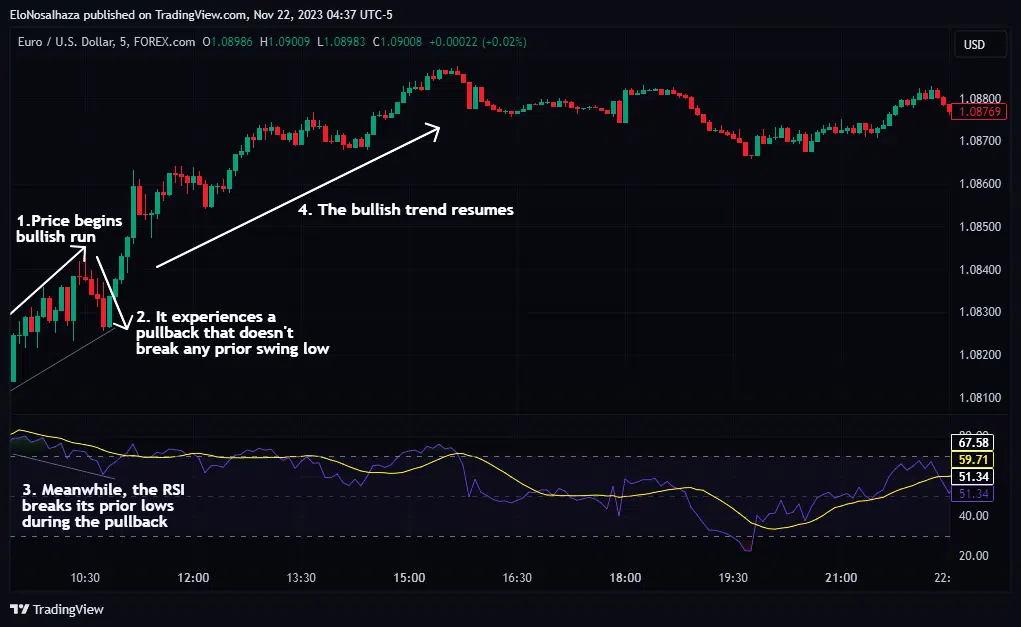
Closely related securities can also form practical divergences for this strategy. An example in the currency market is the EUR/USD and GBP/USD pairs.
4. Optimizing Pullback Trading with a Premium TradingView Indicator
As explicit as the above pullback examples may seem, practicing these techniques in real time can be difficult. Building patience and confidence enough to make these moves demands a lot.
Luckily, one top-tier trading system clears every doubt while revealing the best pullback entries with high precision – The Pullback Factor by Indicator Vault.

It runs on a volatility-based algorithm that is statistically proven to reveal when a current pullback is about to end.
Concisely, below are the many ways it benefits every user:
- Knowledge of when to place orders after pullbacks to ride the entire trend earliest
- Ability to trade on any timeframe, from intra-day charts to one-week periods
- Freedom to explore multiple financial markets for pullback entries, whether stocks, indices, forex, etc
- Liberty to customize its application to suit any trading plan with unique risk management rules
Hard to believe? Watch the Pullback Factor in live trading here.
5. Putting Your Stock Pullback Strategies to Work
Mastering stock pullback trading provides a significant edge in today’s markets. These temporary declines in otherwise strong stocks offer some of the best risk-reward opportunities available to active traders.
The five strategies outlined in this guide – moving averages, trendlines, Fibonacci retracements, breakout pullbacks, and divergence – form a comprehensive toolkit for stock pullback analysis. Each method offers unique advantages and works best in specific market conditions.
Technical analysts can ease the process with the highly recommended Pullback Factor Indicator. Its algorithm, based on the current volatility conditions, ensures users know the end of price pullbacks.
With consistent application of these proven pullback techniques, you’ll transform market dips from sources of concern into reliable profit opportunities.