Discover 5 Essential Trend-following indicators and how they can level up your business. We have the best guides and tips!
Table of Contents
Successful trend trading relies on your ability to identify and follow market trends.
Trend-following indicators are technical tools that help traders identify and confirm the direction of a market trend amidst the noise of conflicting bar chart signals.
They typically measure the direction and strength of trends within a specified time range.
Trend indicators help you make the right decisions in executing trend trading strategies. Using the right indicators can help you avoid losses for a long time.
This article explores five essential trend-following indicators to enhance your trading.
By incorporating these indicators into your analysis, you can gain valuable insights into market trends, improve your timing for entries and exits, and increase your probability.
1. Moving Average (MA)
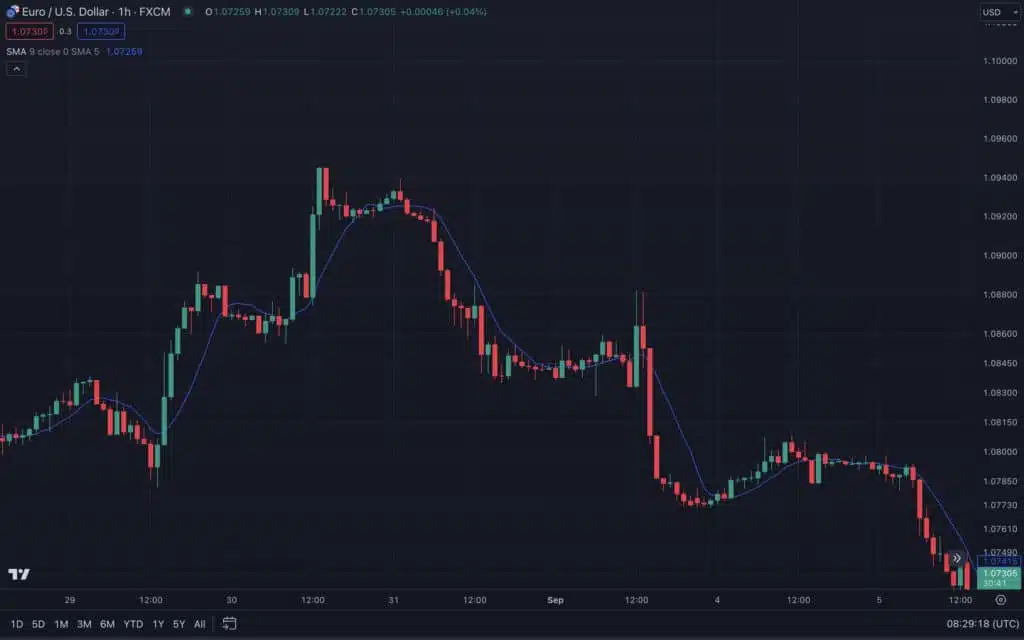
The Moving Average is one of the most widely used trend-following indicators. It helps smooth out price fluctuations and identify the underlying trends.
A Moving Average calculates the average price over a specific time period and draws a line to connect the dots. This line is the Simple Moving Average.
A second type of moving average frequently employed by trend traders is the Exponential Moving Average. This average indicator assigns more weight to recent data points.
EMA calculations assume that the recent price action will have a larger impact on trend direction than when the price points are treated equally. However, Exponential Moving Averages still often generate more false signals than Simple Moving Averages.
To overcome the shortcomings of this moving average, you can examine m several EMAs over a period of days (with 20-day, 50-day, and 200-day periods being popular combinations among traders in recent decades).
2. Moving Average Convergence-Divergence (MACD) Indicator
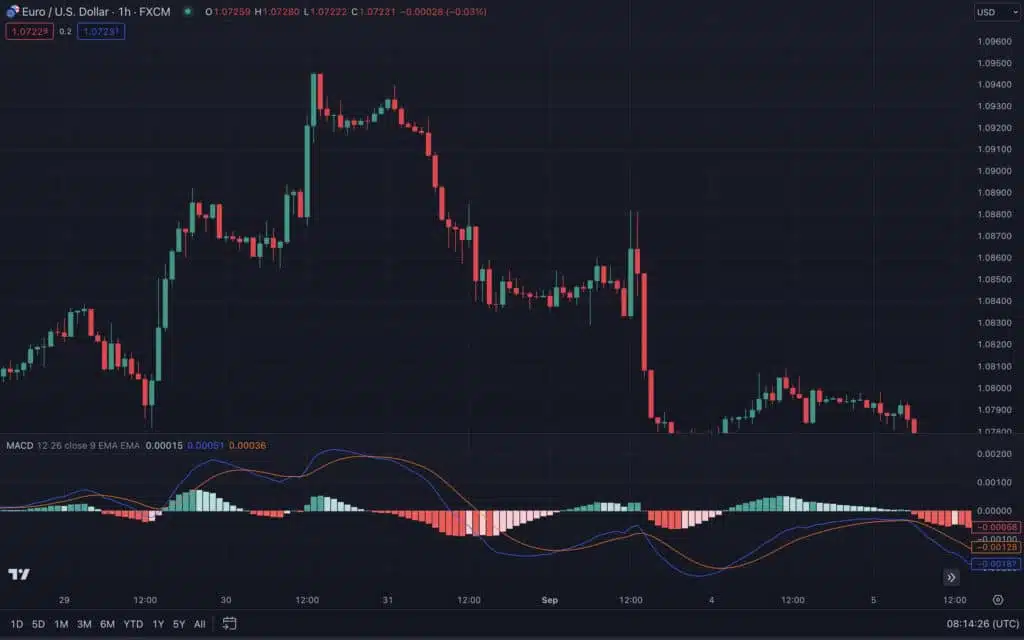
This versatile trend-following indicator combines moving averages at different intervals to derive a set of oscillating directional lines. These directional lines or a histogram helps you gauge the market’s price direction and current momentum.
MACD consists of two lines: the MACD line and the signal line. The MACD line is typically calculated by subtracting the 26-period EMA from the 12-period EMA, while the signal line is drawn from the 9-period EMA of the MACD.
MACD is a lagging trend indicator that limits it in providing accurate signals for price points in fast-moving markets or during periods of high volatility.
MACD signals can also be misleading in a sideways or ranging market. Combining the MACD indicator with other technical indicators helps you get the best long-term trading results.
3. Parabolic Stop and Reversal (Parabolic SAR)
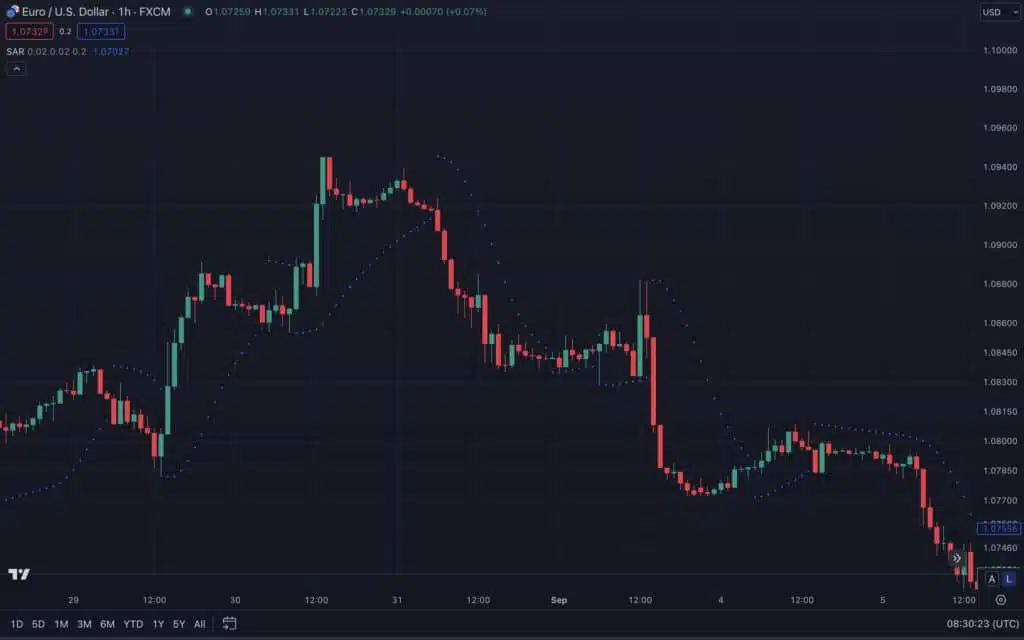
The Parabolic Stop and Reversal (Parabolic SAR) is a unique indicator that provides dynamic support and resistance levels.
Traders use it to highlight trend direction and generate reversal signals. The indicator appears as dots above or below the price on the main chart panel.
It assists in managing long and short positions as you set trailing stop losses to match the price of the previous dot.
Although prone to generating many false signals during sideways conditions, Parabolic SAR can be a reliable indicator of strong trends.
It is most useful when analyzed together with the overall price pattern and other indicators.
4. Average Directional Index (ADX/DMS) Indicator
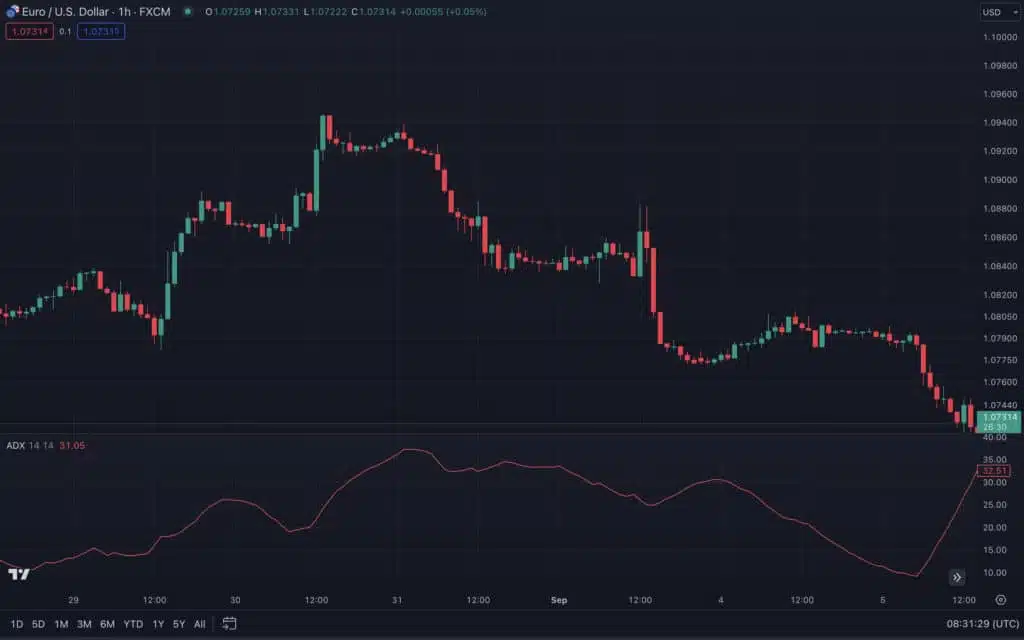
The ADX indicator is a powerful trend-strength indicator that helps you determine the strength of an active market trend.
It gives you an idea of how long a trend may persist before it reverses. Average Directional Index values range from 0-100, with higher values (typically 25-100) indicating stronger trends.
Using the ADX line along with Positive (+DI) or Negative Directional Indicators (-DI) assists in identifying the strength and direction of a trend. ADX indicator is one of the most effective trend indicators, and combining it with other tools can even help you filter out potential false signals.
5. Smooth Trend Finder Indicator - Best Trend-Following Indicator
The Smooth Trend Finder Indicator is a custom indicator specially designed to address the shortcomings of regular trend-following indicators like the SMA, MACD, and Super Trend. Smooth Trend Finder indicator focuses on the most recent candles to help you anticipate future price movements.
It analyzes the variations between the latest close price, the highest high, and the lowest low of previous prices in both long and short periods. Using this evaluation, the indicator predicts whether a major trend change is about to happen.
This increased reactivity to trend changes leads to the generation of timely alerts that help you tackle the problem of late entries and suboptimal exits. You’re well informed on when to enter or exit trades and properly profit off market trends.
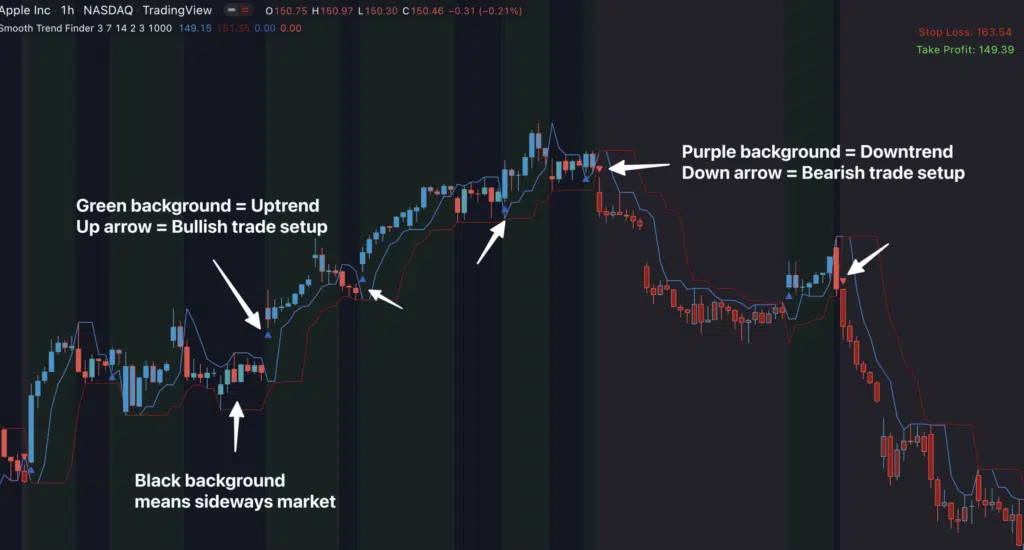
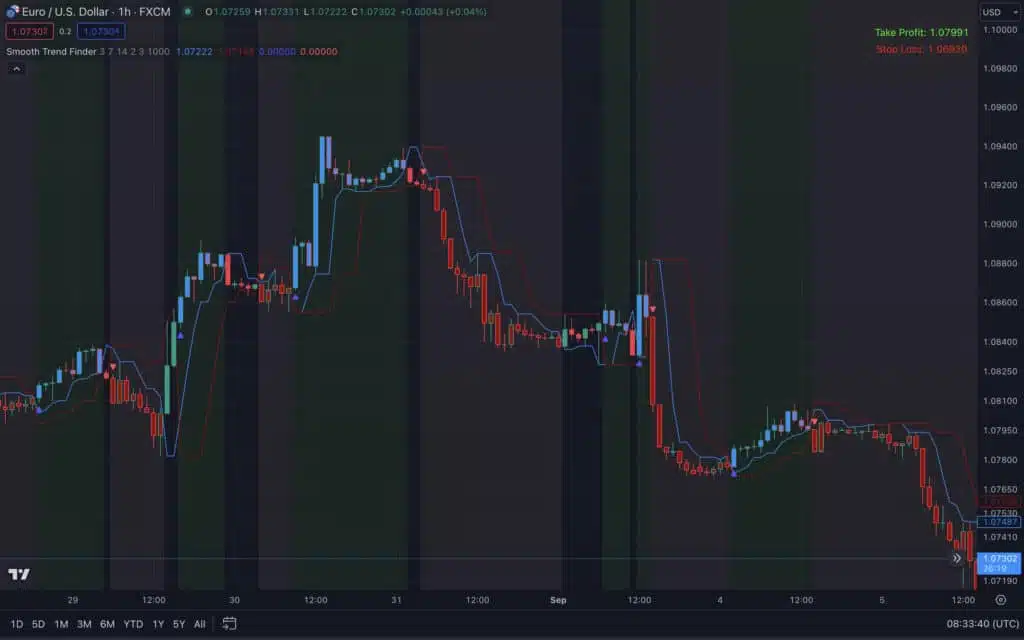
The Smooth Trend Finder indicator determines when the market is sideways or choppy so you can adjust your trading strategy accordingly. This helps you avoid unnecessary entries and potential losses.
This indicator is also incredibly useful for filtering market noise and false signals through its smoothing mechanism. With a user-friendly interface and customizable options, it is the most essential trend indicator to take your trading to the next level. And you can start enjoying this transformative tool right away.
6. Conclusion
Incorporating trend-following indicators into your trading strategy can significantly improve your ability to identify and follow market trends, hence your trading results.
The Moving Average, MACD, Parabolic SAR, ADX, and Smooth Trend Finder are five essential indicators that provide you with valuable insights into trend direction, strength, and potential reversal points.
However, it’s important to note that no single indicator can guarantee profitable trades, and it’s advisable that you combine these indicators with other forms of analysis and risk management techniques.
Additionally, you can practice and gain experience with these indicators in different market conditions to further enhance their effectiveness.

