Supply and Demand zones provide better signals than regular Support and Resistance levels. Make better decisions and improve your trading skills with the new Supply Demand zone PRO indicator for TradingView. It is a powerful technical indicator that displays the strongest zones on the charts using colors. It suggests ‘stop loss’ and ‘take profit’ prices and also offers customizable alerts.
Table of Contents
1. Introduction
The price of any financial market asset is largely determined by its supply and demand forces. Traditionally, higher demand leads to price increment while higher supply leads to a decline in prices. In the forex market as well as other financial markets, supply and demand zones are important because they can be used to predict when the price is about to change direction.
Prices are constantly fluctuating and traders are tasked with forecasting the price direction correctly, else losses are inevitable. So, studying the price movement in relation to the demand and supply is very important; especially for traders who generate their signals through technical analysis.
From the charts, traders need to identify when prices are about to reverse so that they can take a position in time to profit from the impending reversal.
Before the price of an asset changes direction, the following usually happens:
- Suppliers or sellers enter the market in large numbers thereby crashing the price.
- Buyers plunge into the market increasing the demand and shooting up the price in the process.
- Sometimes, there is a period of consolidation, where the market has no clear direction as the number of buyers and sellers appear to be equal.
2. Supply and Demand Zones in a chart
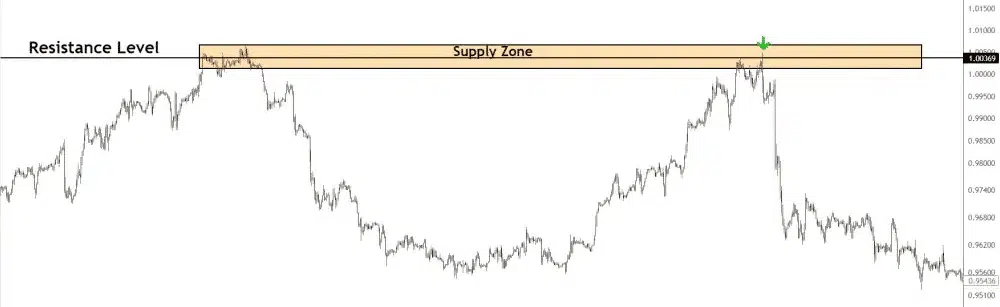
These zones represent areas on the chart where prices are likely to change due to demand or supply pressure. Supply zones depict areas where prices are likely to fall while Demand zones show areas where prices are likely to surge. These zones represent a wider price area when compared to the popular Support and Resistance levels which forms the basis of many trading strategies.
Support and Resistance levels rely on historical prices to serve as virtual barriers to prices. Resistance level limits price increments where prices are likely to bounce back downwards while the support level does the opposite by limiting price decline. But, Supply and demand zones create an area at the base of the price movements.
If a trader can accurately draw the supply and demand zones on a chart, he can generate his entry signals as follows:
- If the current price hits the supply zone, then it is a ‘sell’ signal.
- If the price touches the demand zone, it is a ‘buy’ signal.
But the problem is that it is tasking for a trader to accurately draw the demand and supply zones on the charts. It takes a lot of time to manually scan the charts to identify these setups. This is why the use of a technical indicator is recommended.
3. Supply Demand PRO indicator for TradingView (SD PRO)
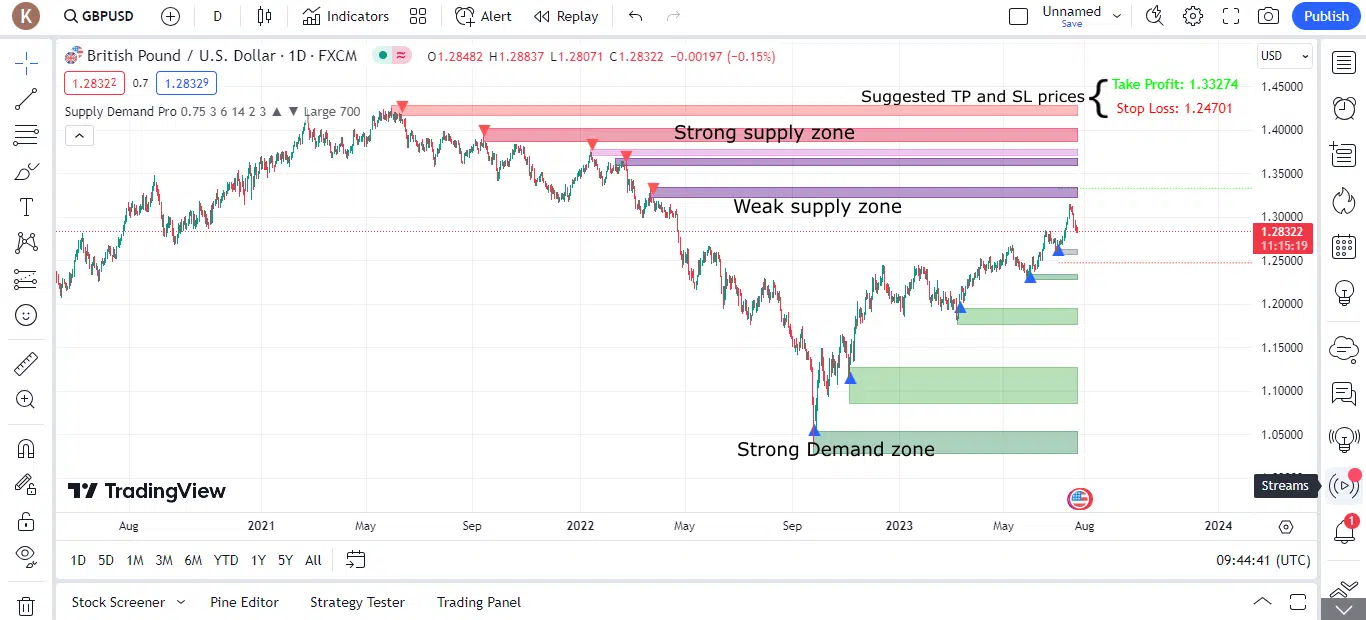
SD PRO is a technical indicator that scans the charts, accurately identifies where the strong demand and supply zones occur, and then displays them in colors. By default, the demand zones are green while the supply zones are red. That’s not all; it also gives you the best entry points as well as ‘stop loss’ and ‘take profit’ prices.
Many indicators are available but the best Supply Demand zone indicator is the SD PRO which is available on the TradingView charting package. With the SD PRO, a forex or stock trader can make well-informed trading decisions as it is almost an automated solution.
3.1 How to use the Supply Demand PRO indicator for TradingView
Once you apply the SD PRO on a TradingView chart, it automatically locates the strong and weak supply and demand zones and differentiates them with colors. If you do not like the default colors, you can change them in the indicator settings.
Follow the steps below:
- Log into TradingView and open the charts.
- Click on ‘indicators’; choose ‘invite-only scripts’ and select ‘Supply Demand Pro indicator’.
- The indicator will automatically display its colors on the charts. You can select any timeframe of your choice. But, to see the action of the indicator in real time, choose a small timeframe. Let us consider an example.
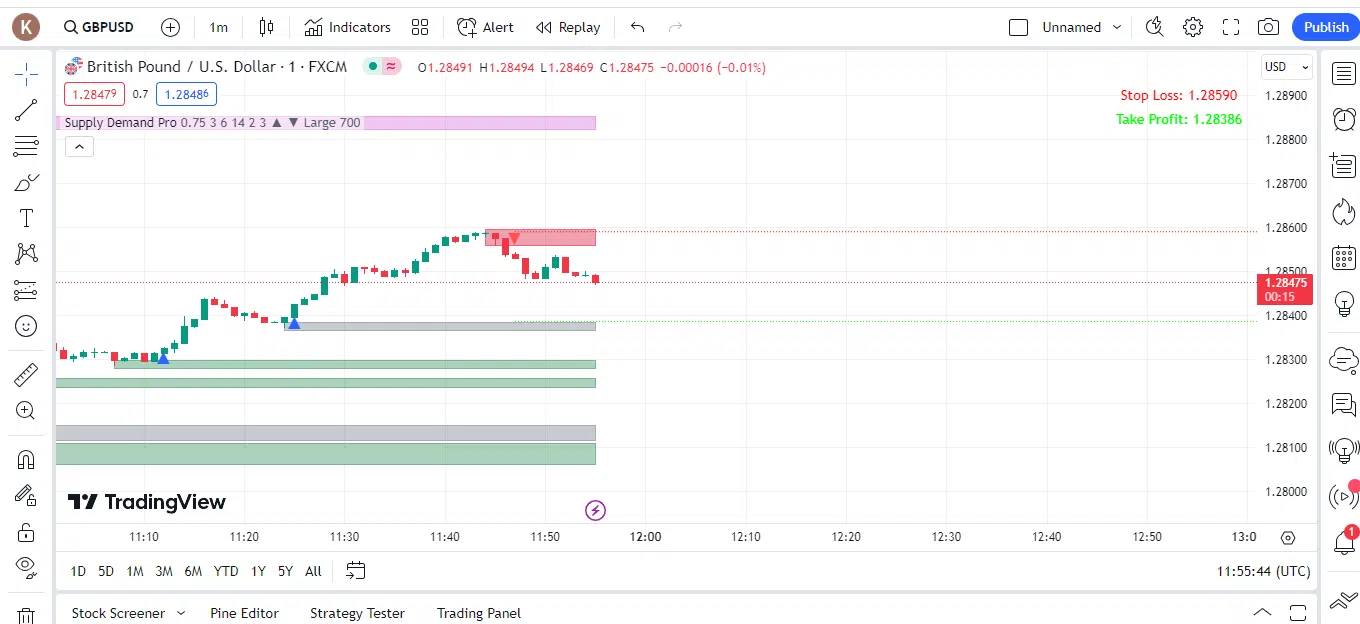
From the above 1-minute chart, you can see that the indicator has suggested a sell trade from the red supply zone; it has also suggested a Stop loss price at 1.28590 and take profit at 1.28386; meanwhile, the current price is at 1.28475.
- The trader can decide to open a position based on the indicator’s signals.
Using the alerts
If you do not have time to monitor the charts, the Supply Demand PRO comes with multiple alerts which will notify you when a new zone appears on the chart.
To set alerts:
- Choose your timeframe and open the SD PRO indicator
- On the indicator heading, click on the ‘more button’.
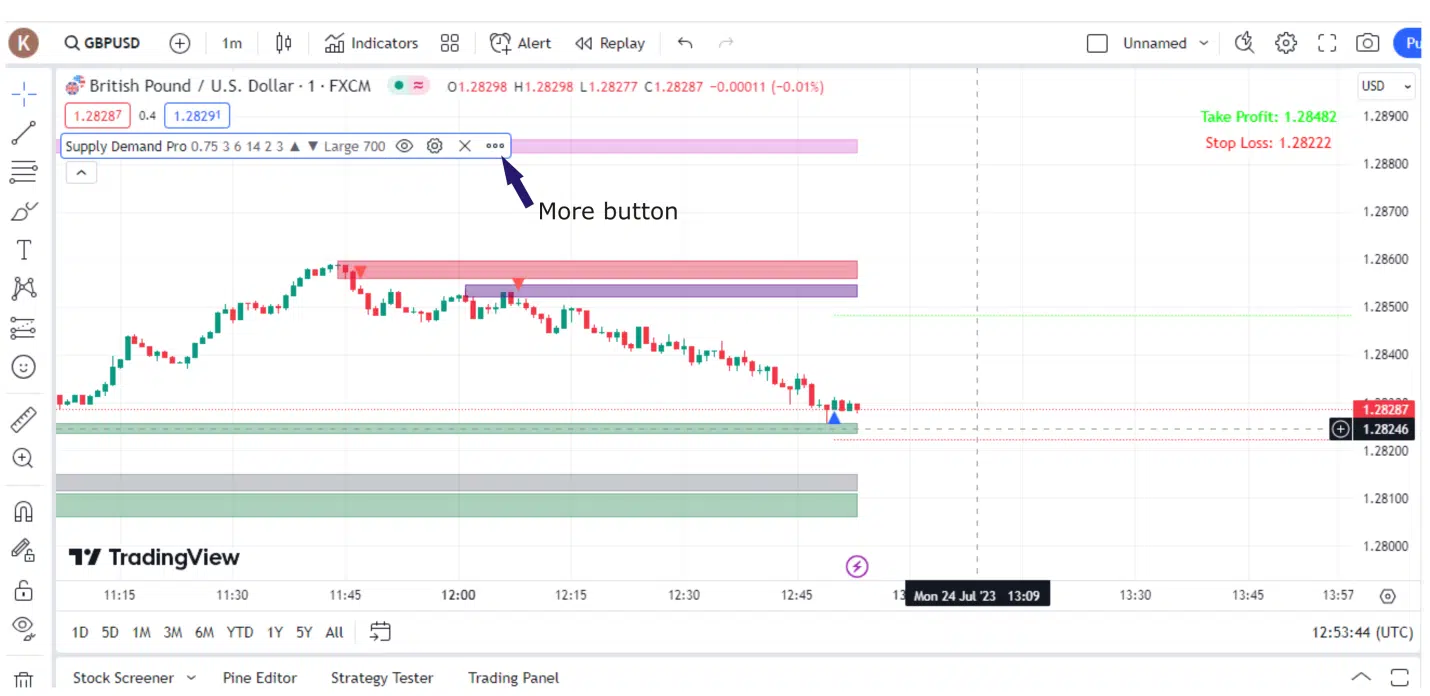
- Choose ‘add alert on Supply Demand Pro…’
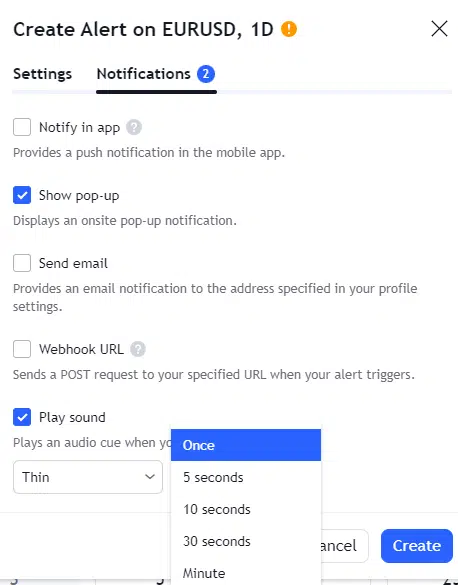
- Use the ‘settings’ and ‘notifications’ tabs to customize the alerts to your preferences. You can choose in-app notification by pop-sound, email notification, etc.
3.2 Getting the Supply Demand Zone PRO indicator
There are 3 buying options:
- Click here to buy the indicator for $99. It comes with lifetime access with no recurring bills.
- Buy it as a ‘Duo bundle’ with another powerful indicator; ‘Logic Day Trading for TradingView’ for only $179.
- Pay a monthly fee of $199 and get access to every custom indicator for TradingView as well as all future indicators.
Once your order is confirmed, you will complete a form and input your TradingView username. You will be given access within 24 hours.
4. Conclusion
Some popular indicators like the MACD or RSI may help in finding possible Demand and supply zones, but the best Supply and Demand zone indicator is the SD PRO for TradingView. It is more comprehensive, easy to use, fully customizable, and has a high potential of generating accurate signals.
You can set the indicator to alert you when a new zone is formed on the charts, then you can make your entry and also use the suggested stop loss and take profit prices.
No need to waste time, get the Supply Demand PRO now. It does all the hard work while you simply open positions. Here are a few reasons why you should get the Supply Demand PRO indicator for TradingView:
- Very high probability of finding accurate reversal prices on the charts.
- It gives clear supply and demand zones defined by different colors.
- It suggests SL and TP prices for you.
- It works on all timelines.
- Works on multiple markets including currency pairs, stocks, CFDs, etc.
- Eliminates time that would have been spent on manual technical analysis.
You can also ask questions, make suggestions, or share your results in the engaging comment section below.