
Struggling with RSI’s lagging signals? The A-RSI Indicator eliminates delays, spots pullback entries, and detects bullish & bearish divergences with precision.
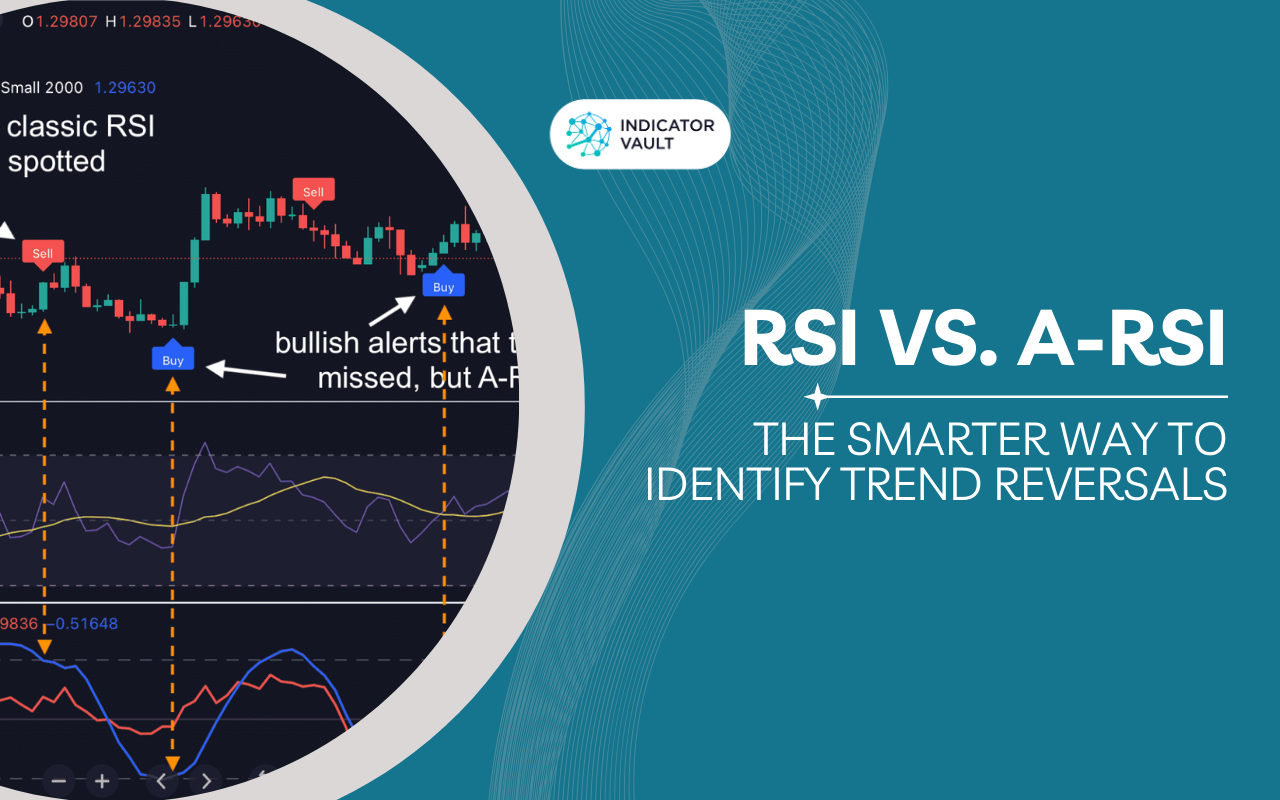
The traditional RSI (Relative Strength Index) can struggle to accurately identify great-timing price direction changes due to its nature as a lagging indicator, which reacts to price movements rather than predicting them. While it signals overbought or oversold conditions, these levels can be misleading in strong trends, often resulting in false signals.
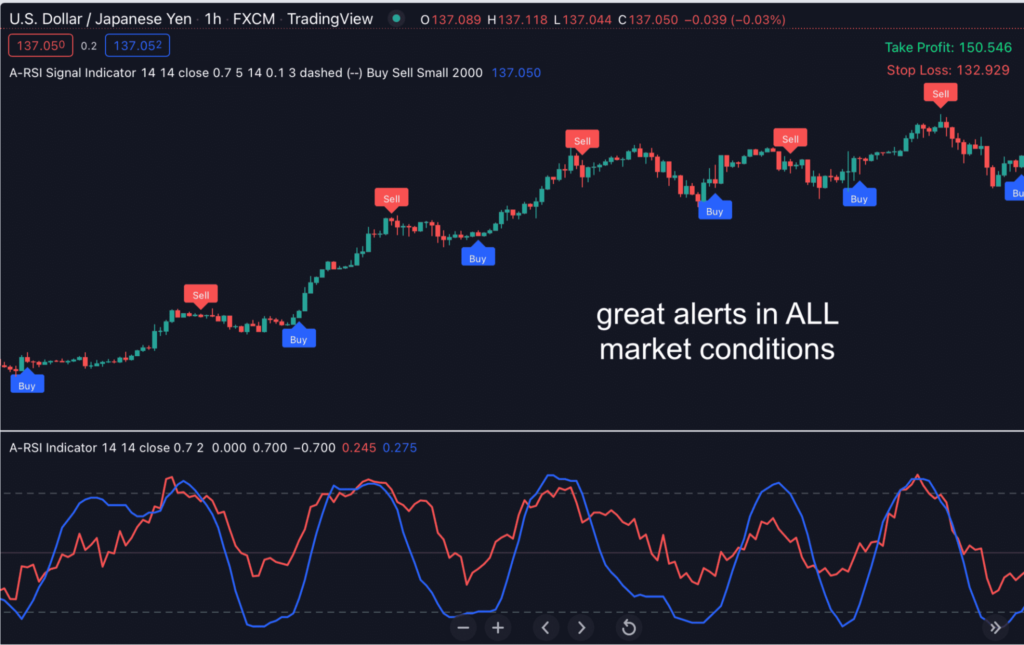
Additionally, its ability to detect divergences may not be effective in all market conditions, and in volatile markets, RSI can generate unreliable alerts. If you’re still using the classic RSI, you’re missing out on a powerful tool that can revolutionize your trading experience. The A-RSI Indicator is here to elevate your strategy with unparalleled precision and insight.
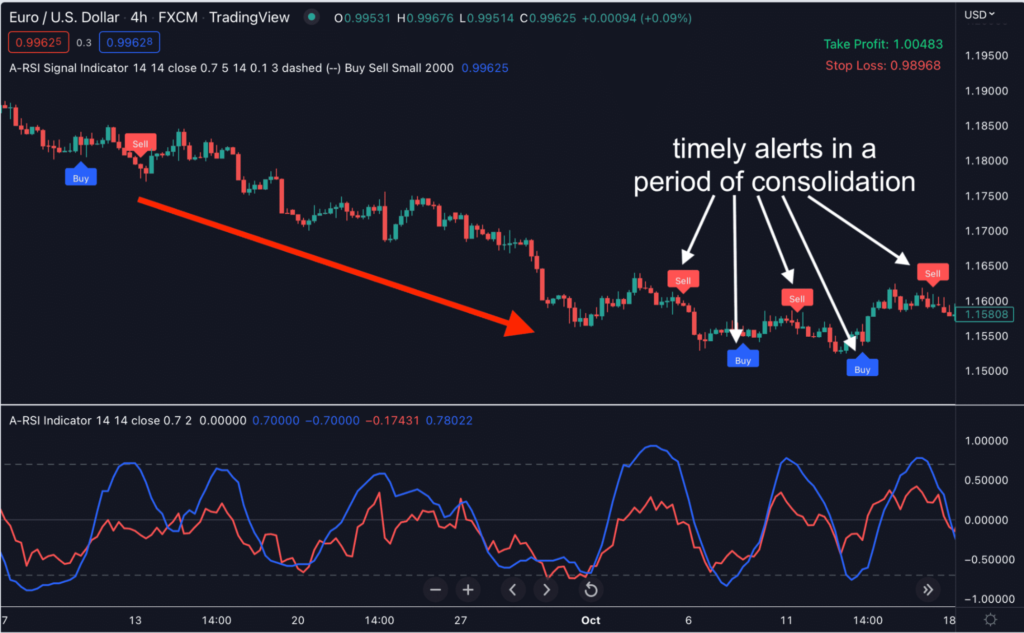
The A-RSI Indicator is your ultimate tool for pinpointing precise price direction changes in the market. Unlike traditional RSI, it utilizes advanced algorithms to provide clearer signals, enabling you to make timely trading decisions with confidence. With its ability to identify optimal entry points during trending markets, you can capitalize on price movements effectively.
Furthermore, this indicator excels at detecting bullish and bearish divergences, allowing you to anticipate potential trend reversals before they happen. Embrace the power of A-RSI to transform your trading strategy and seize profitable opportunities as they arise.
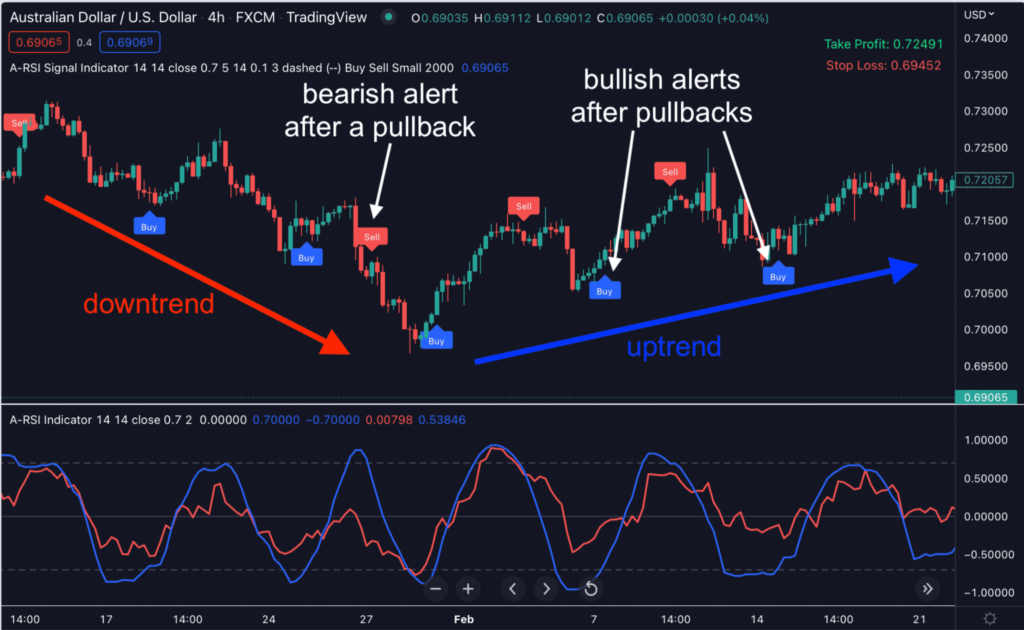
Trending markets demand precision. Enter too early? You get stopped out. Enter too late? You miss the move. A-RSI eliminates the guesswork by accurately detecting pullbacks, ensuring entries happen at the perfect moment—just as the trend regains momentum. No more second-guessing or premature trades; it helps you stay ahead of market moves from start to finish.
Follow these simple trading rules: In an uptrend, enter when the indicator signals oversold conditions (its value is below -0.7). And in a downtrend, enter when the indicator signals overbought conditions (its value is above +0.7). The blue or red arrow flagged by A-RSI indicates the position where a price correction takes place. The price will reverse after a pullback and move in the direction of the prevailing trend.
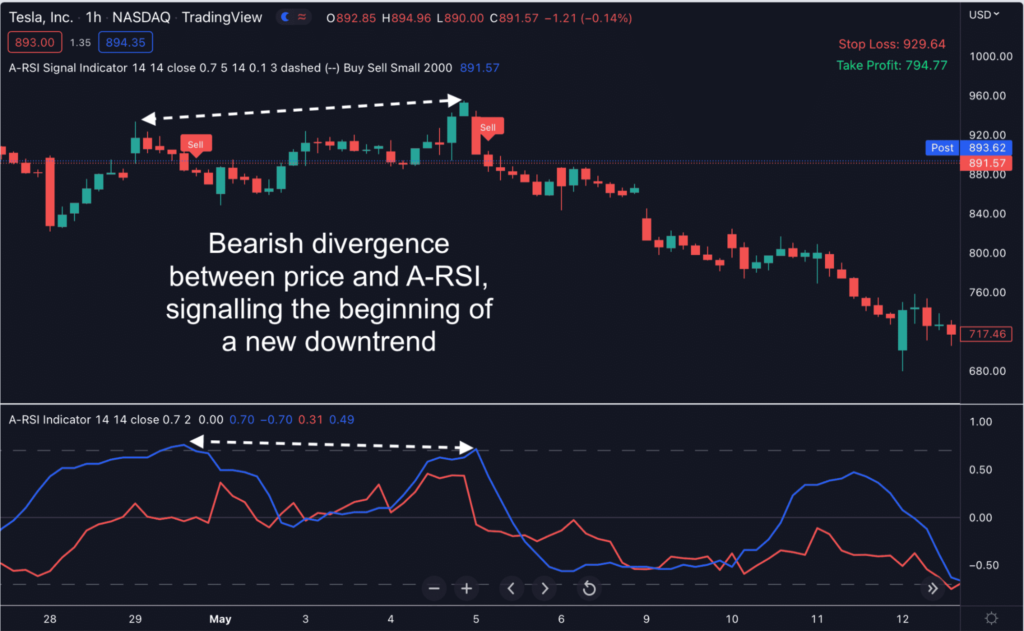
Market reversals often start with hidden divergences. Traditional RSI fails to catch these signals early, leaving you chasing trades instead of positioning yourself ahead of the move. With A-RSI’s advanced divergence detection, you’ll see bullish & bearish divergences instantly, providing the perfect heads-up before trends shift. Whether a bullish divergence signals fading selling pressure or a bearish divergence warns of buyer exhaustion, it gives you a critical advantage in spotting reversals before they fully unfold.
Stop second-guessing your trades. Stop relying on outdated indicators. A-RSI gives you the precision, timing, and confidence you need to dominate the market. Click here to see this indicator in action.


