Understanding ATR in trading is essential for traders who want to read volatility correctly, avoid false entries, and catch trends before they fully mature. While many traders use ATR only for stop loss placement, its true power lies in revealing when the market is ready to move. When combined with advanced trend-detection logic, ATR-based insights can significantly improve trade timing and accuracy.
Table of Contents
1. What is ATR in trading?
ATR stands for Average True Range, a volatility indicator developed by . Welles Wilder. Unlike trend indicators that show direction, ATR measures how much price is moving, regardless of whether the market is bearish or bullish.
In simple terms, ATR answers one question: How volatile is the market right now?
The ATR value is calculated using the true range, which considers:
- The current high minus the current low
- The absolute difference between the current high and the previous close
- The absolute difference between the current low and the previous close
These values are averaged over a specific period (commonly 14). The result is a dynamic volatility metric that expands during high-volatility phases and contracts during quiet or sideways markets.

2. What does the ATR tell you?
When traders talk about ATR in trading, they are usually referring to three key insights:
Market volatility strength: A rising ATR means volatility is creasing, often during breakouts or strong trends. A falling ATR signals consolidation or a ranging market.
Trade environment quality: Markets with low ATR tend to produce choppy price action and false breakouts, making them difficult for trend-following strategies. In contrast, high ATR environments usually support cleaner price moves, where trends have more room to develop and trades have a higher probability of success.
Risk management context: ATR is widely used to set adaptive stop loss and take profit levels that adjust to market conditions rather than fixed pip values.
However, ATR alone does not tell you the direction of the trend. It cannot confirm whether a price move is sustainable, nor can it accurately signal when a new trend is about to begin.
This gap is where most traders struggle and where modern, volatility-aware trend indicators step in.
ATR algorithm in powerful trend indicators
Advanced indicators do not display ATR as a simple line. Instead, they embed ATR logic into decision-making algorithms.
Rather than asking “How volatile is the market?”, they ask:
- Is volatility expanding relative to recent price extremes?
- Is the latest close price breaking meaningful historical boundaries?
- Is volatility confirming a major trend or just noise?”
This is exactly the problem Smooth Trend Finder was designed to solve.
3. How Smooth Trend Finder uses ATR logic
Smooth Trend Finder is not a traditional ATR tool, but ATR- based volatility logic plays a critical role inside its algorithm.
Instead of lagging behind price like moving averages, Smooth Trend Finder:
- Evaluates the latest close price
- Compares it again the highest high and lowest low over both short-term and long-term periods
- Confirms whether volatility expansion supports a real trend shift
This approach allows the indicator to prepare traders for what comes next, not what already happened.
Triple confirmation algorithm explained
To reduce false signals, Smooth Trend Finder relies on its proprietary triple confirmation algorithm. Instead of reacting to every small price fluctuation, the indicator first looks at the latest closing price to see whether it truly breaks above or below recent price extremes.
It then takes a step back and checks the same behavior over a longer historical range, helping filter out short-lived spikes that often trap traders.
Finally, Smooth Trend Finder evaluates the overall market condition, determining whether the market is actually trending or simply moving sideways.
By combining these three layers of confirmation, the indicator only gives you alerts when the setup has a much higher chance of leading to a big move.
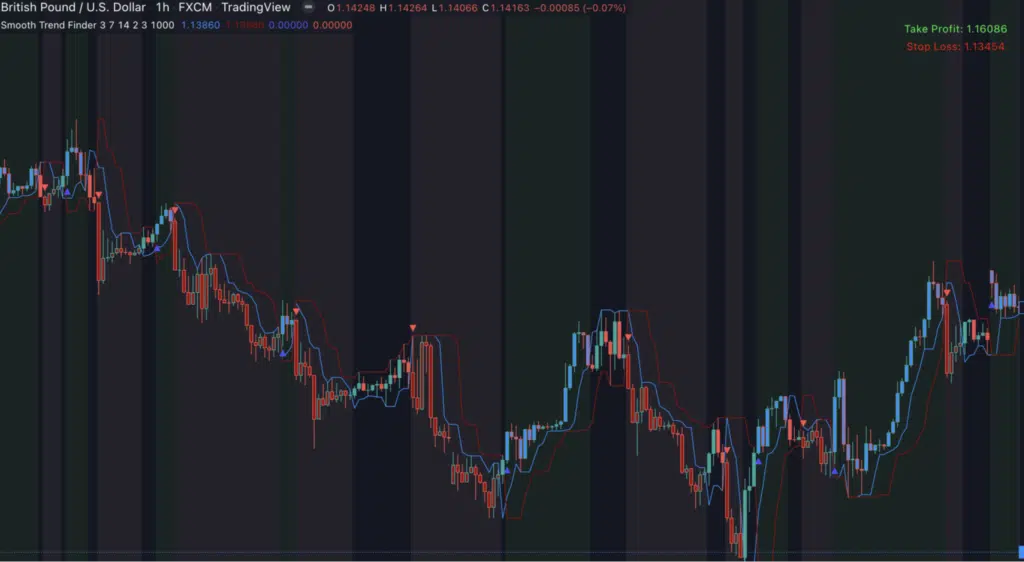
4. How the Smooth Trend indicator works on a chart
On live TradingView charts, Smooth Trend Finder translates complex calculations into clear visual signals

Bullish and bearish arrows indicate potential trend starts.
Background color changes reflect current market conditions. Sideways market detection warns traders to stay out of low-quality setups.
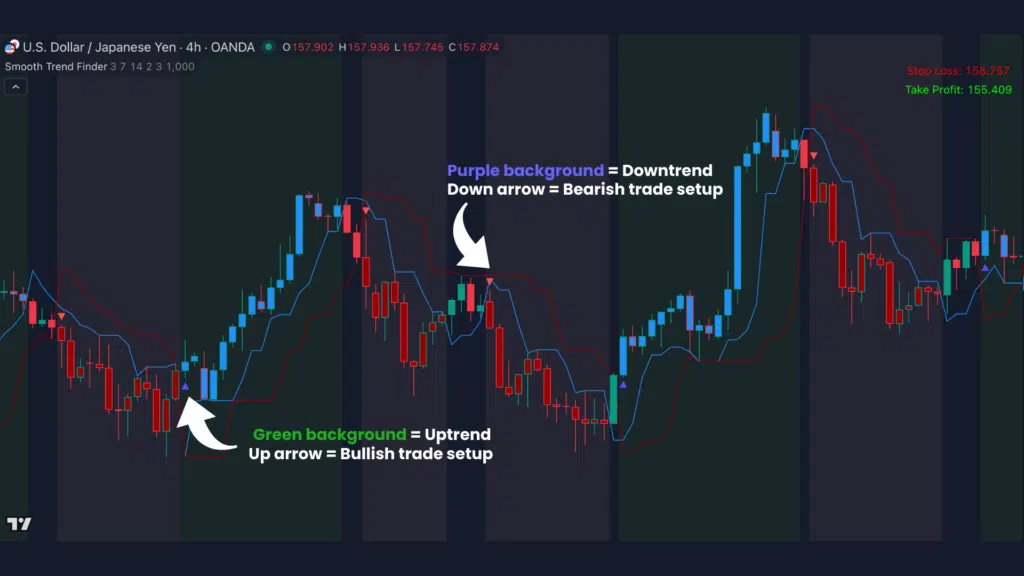
Instead of reacting late like traditional trend-following tools, Smooth Trend Finder helps traders enter earlier, exit smarter, and avoid choppy conditions.
5. Final thoughts
ATR in trading remains one of the most important concepts for understanding how markets move. It teaches traders when to be aggressive, when to be cautious, and when to stay out.
But in fast, modern markets, raw volatility data is not enough.
Smooth Trend Finder takes the principles behind ATR and applies them through a smarter, faster, and more reliable framework, helping traders to catch trends earlier and avoid sideways noise.
If you want to move beyond lagging indicators and start trading volatility as it unfolds, Smooth Trend Finder is a powerful next step.