Understanding the difference between leading vs lagging indicators is of significant value in any technical analysis strategy. This classification ensures a detailed understanding of market momentum and trend maturity during profit exploitation.
But what exactly are leading vs lagging indicators? How can a trader make the most of them to anticipate moves versus confirming them?
Keep reading this article for answers to these and many other queries regarding their nature, specific examples, and practical applications in live trading.
Table of Contents
1. Leading vs Lagging Indicators: Fundamental Differences and Technical Roles
What exactly is the difference between leading vs lagging indicators? In short, it comes down to timing: leading tools aim to predict price movements before they happen, while lagging tools confirm a trend that is already underway.
Leading indicators are financial clues that hint at a market’s potential performance, direction-wise (typically bullish or bearish). They are not strictly limited to trading platform tools and can include real-world factors, such as increased orders for goods and services.
However, in retail trading, leading indicators are technical analysis platform tools that signal a potential market direction. The most common examples include the Moving Average (MA) and Relative Strength Index (RSI).
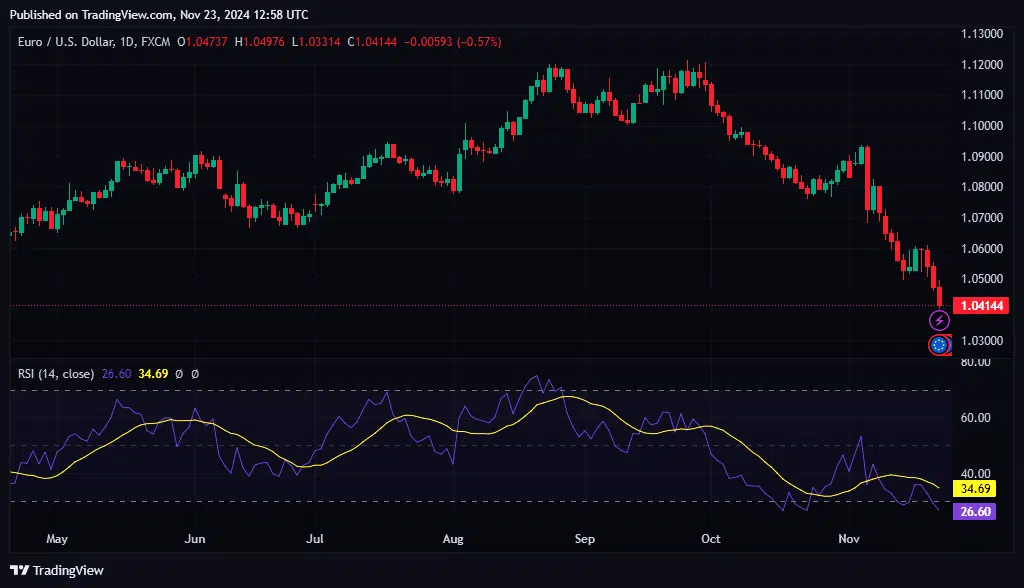
Leading indicators are handy for forecasting in technical analysis because developers design them to be predictive. Their increased sensitivity aids their much quicker reactions than the broader market, allowing users to make potentially profitable decisions quickly.
For instance, a golden cross with the Moving Average (MA) indicates a possible bullish trend. Hence, this insight influences subscribers to this idea as they seek confirmation from other sources, such as increasing volume and classical chart patterns.
On the other hand, lagging indicators, as the name suggests, are tools that recognize the financial market changes (typically trends) after they occur. They lag behind the market of interest, further revealing the updates (if any).
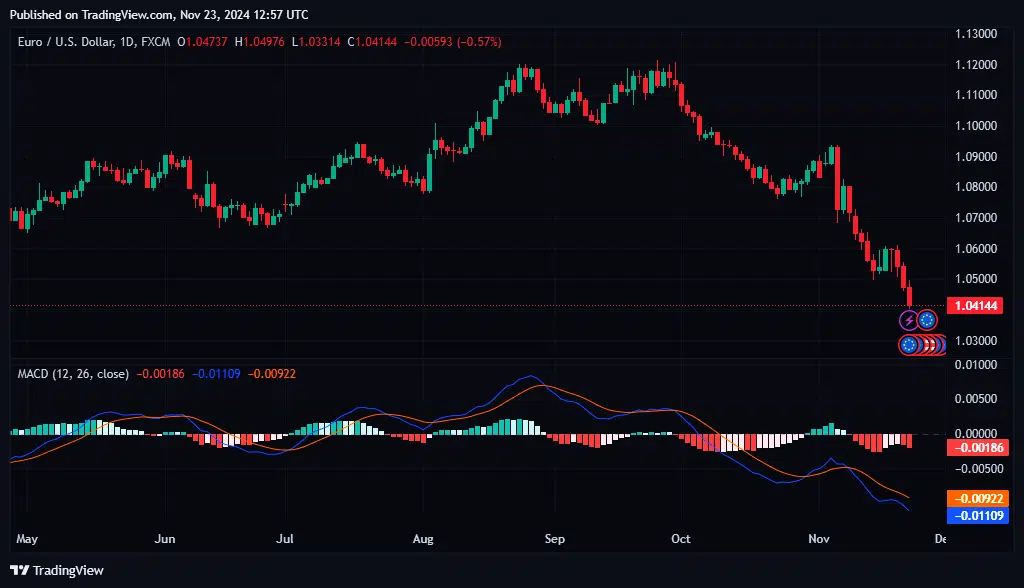
Some examples of these technical analysis tools include the Bollinger Bands and Moving Average Convergence Divergence (MACD).
However, like leading indicators, lagging ones may not always be trading platform tools. Any country’s Gross Domestic Product (GDP) and unemployment are valuable economic signals with a ‘lagging’ effect on its markets.
The most significant advantage of lagging indicators in technical analysis lies in their ability to confirm a trend.
Every trader (experienced and novice) is prone to false signals from any source. Fortunately, lagging indicators keep users relatively safe since the market has already established the trend.
For example, imagine a trader notices a currency pair’s price break out of a lengthy consolidation, rallying above the Bollinger Bands (a lagging signal for increased volatility).
Such a trader can enter long positions, anticipating a sustainable trend continuation.
2. Leading vs Lagging Indicators: Proven tips to perfection
Optimizing your strategy requires balancing leading vs lagging indicators to reduce noise and confirm trends. Leading tools (like RSI) identify early shifts, while lagging tools (like Moving Averages) provide essential confirmation.
The notable contrasts between leading and lagging indicators make pro analysts prefer combinations of both types for a holistic analysis. It provides a much-needed balance between prediction and confirmation.
Leading indicators signal market changes moments before they occur, unlike lagging ones that confirm them after the act.
Hence, the following pointers are invaluable for this approach:
2.1 Ensure the Indicators Align With an Already Existing Trading Style
New adopters of this strategy should consider infusing the proper indicator pair seamlessly into their contemporary strategies.
Period-wise, the short-term RSI and 20-day moving average (leading and lagging) will work best for scalpers and day traders.
Longer-term traders can combine longer-term indicators, like the MACD with Bollinger Bands or the MA with an increased period.
2.2 Adjust the Indicator Settings Based on the Asset
Some financial assets are typically more volatile than others as the liquidity and risk tolerance vary by market.
It’s essential to compensate for these differences by fine-tuning the lagging and leading indicators accordingly.
For example, shorter RSIs and MAs provide better leading signals in volatile markets, while a smoother trend will work best on a longer period Bollinger Bands.
2.3 Simplify the Strategy Combination
Simpler is almost always better in this case, especially when there’s already an existing strategy to combine the leading & lagging tools with.
Overloading the chart is a common practice among traders of this nature.
It eventually leads to inconsistent signals.
Luckily, it is completely avoidable by choosing the fewest and most basic tools without compromising on quality.
2.4 Test the Indicators on a Simulated System
Trading techniques involving lagging and leading indicators are more complex than they appear on paper. Traders must be highly observant and perceptive to notice and exploit both signal types.
Thus, pros recommend testing them until satisfaction on a demo account.
Forward tests should also accompany historical data evaluations.
3. Catching Every Market Reversal Like a Pro With the Natural Momentum Indicator
Typically, most technical analysts will use leading indicators more frequently than lagging ones owing to their predictive nature. The most significant downside to this choice is the increased risk of false signals.
Thankfully, Indicator Vault has developed a near-perfect solution – The Natural Momentum Indicator for TradingView.
It is a massive upgrade to traditional momentum indicators like the Stochastics, RSI, and MACD due to its lightning speed and lag-free nature.
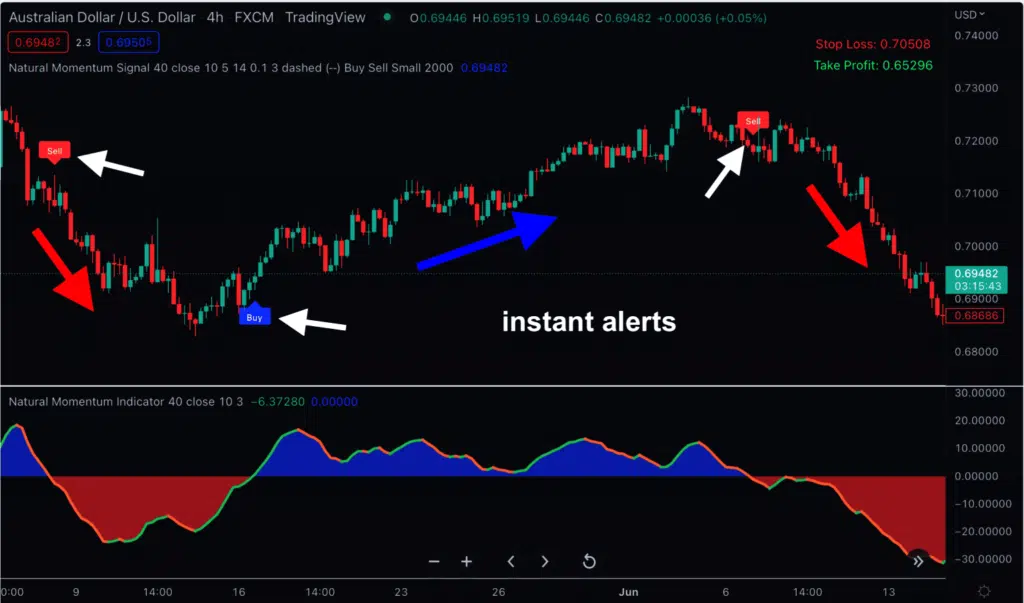
Concisely, below are some of its unmatched benefits:
- Quickest awareness of a trend reversal (bullish or bearish)
- Deeper insights into the contemporary and near-term market nature
- Ability to trade in any market and timeframe desired
- Confidence in taking every opportunity owing to the reliable alert system encoded
Sounds fake? Click here to confirm the jaw-dropping power of this tool today!
4. Final Thoughts
Leading and lagging indicators have their place in technical analysis for optimum results. The former reveals potential market moves, unlike the latter which confirms signals after they’ve manifested.
As discussed, traders interested in combining both for analysis should consider the following suggestions:
- Ensure the Indicators Align With an Already Existing Trading Style
- Adjust the Indicator Settings Based on the Asset
- Simplify the Strategy Combination
- Test the Indicators on a Simulated System
Alternatively, the Natural Momentum Indicator by Indicator Vault provides one of the best applications of a leading tool. It is a must-try for traders of all experience levels.
Please share this article with other trading antics for more exposure to this vital topic, and remember to leave an opinion, question, or result below.