
Divergences Revolutionize Trend Reversals For Explosive Growth
Divergences theory has swiftly become one of the most trusted for reversal trading. Dive into this article to learn its inner workings, triggers, and types.
The divergence theory has swiftly become one of the most trusted for reversal trading. Market participants, accomplished and novice, find ways to incorporate it into potentially fruitful strategies.
Thus, this article dives into its inner workings, including the triggers and types for improved insights. Readers will also gain exclusive access to a top-tier indicator predicated on the concept.
Divergence entails any notable inconsistency between two or more market entities that are closely related. Such entities include assets and indicators in different combinations.
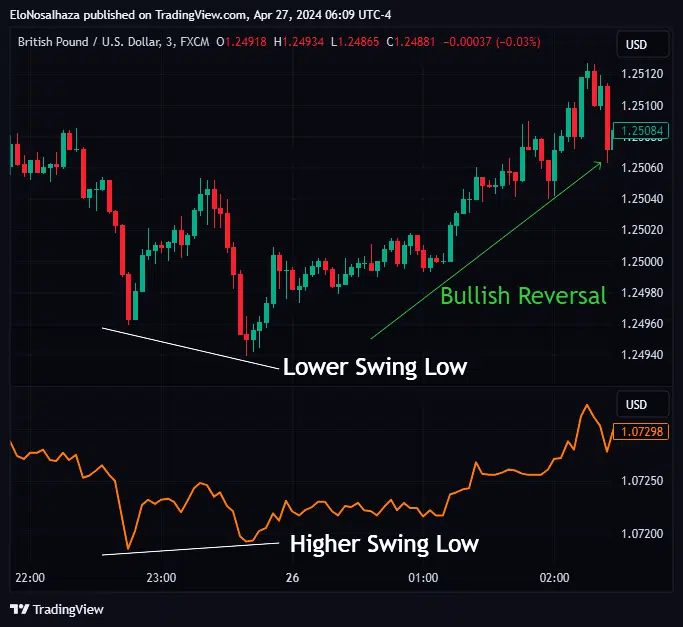
In related pairs, the formation of a higher/lower swing high or low at a particular period should appear on both charts. When this fails, the phenomenon is known as a divergence.
Extensive technical studies reveal that divergences precede significant trend reversals. These can be bullish or bearish across various timeframes, but like every trading strategy, such forecasts can also be imperfect.
As discussed, divergence discovery is from comprehensive poring over charts and past results. There is little fundamental backing behind the belief.
Hence, inference from similar studies discloses the following as possible reasons behind the event:
Divergences occur when a bullish/bearish trend is approaching its peak/trough. One of the entities loses its momentum faster than the other.
Hence, reversal trading proponents anticipate an opportunity sooner or later.
Shifts in investor sentiment can also manifest as divergences in the markets.
For instance, a bullish divergence may occur when more buyers engage in a market despite a price decline and vice-versa.
Particular technical indicators are designed or can be adjusted to delay reactions to price movements. When significant enough, it yields a divergence that can also be exploited.
Large financial institutions, as prime market movers, can deliberately instigate manipulations that could cause divergences. Such scenarios may deceive ignorant traders in the process.
As divergences depend on swing highs and lows, volatility changes play a huge role in their formation. Periods of increased fluctuations will generate more potential opportunities, which may sometimes be unfavorable.
The divergence theory has also enjoyed technical analysis’s continuous evolution. Several tweaks help users make the most from reversal trading.
However, below are the two most popular ways it can be classified, extensively discussed in this article:
The most popular classification of divergences reveals the type of reversal imminent – bullish or bearish.
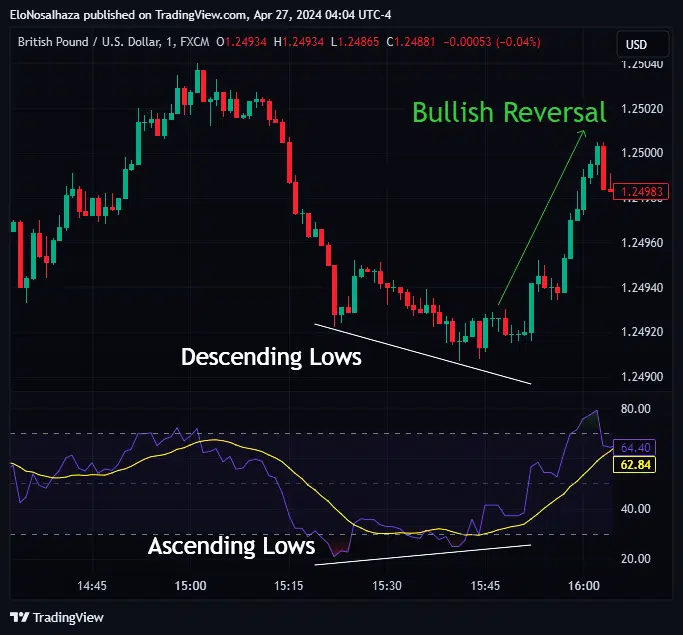
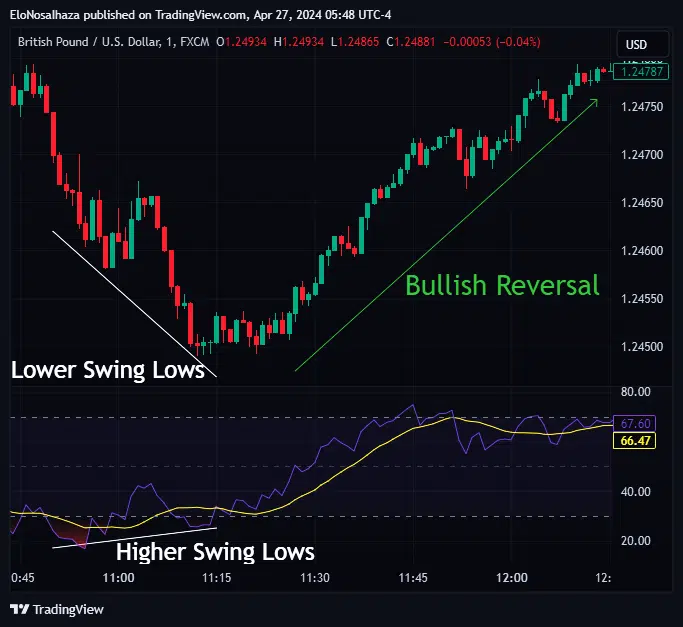
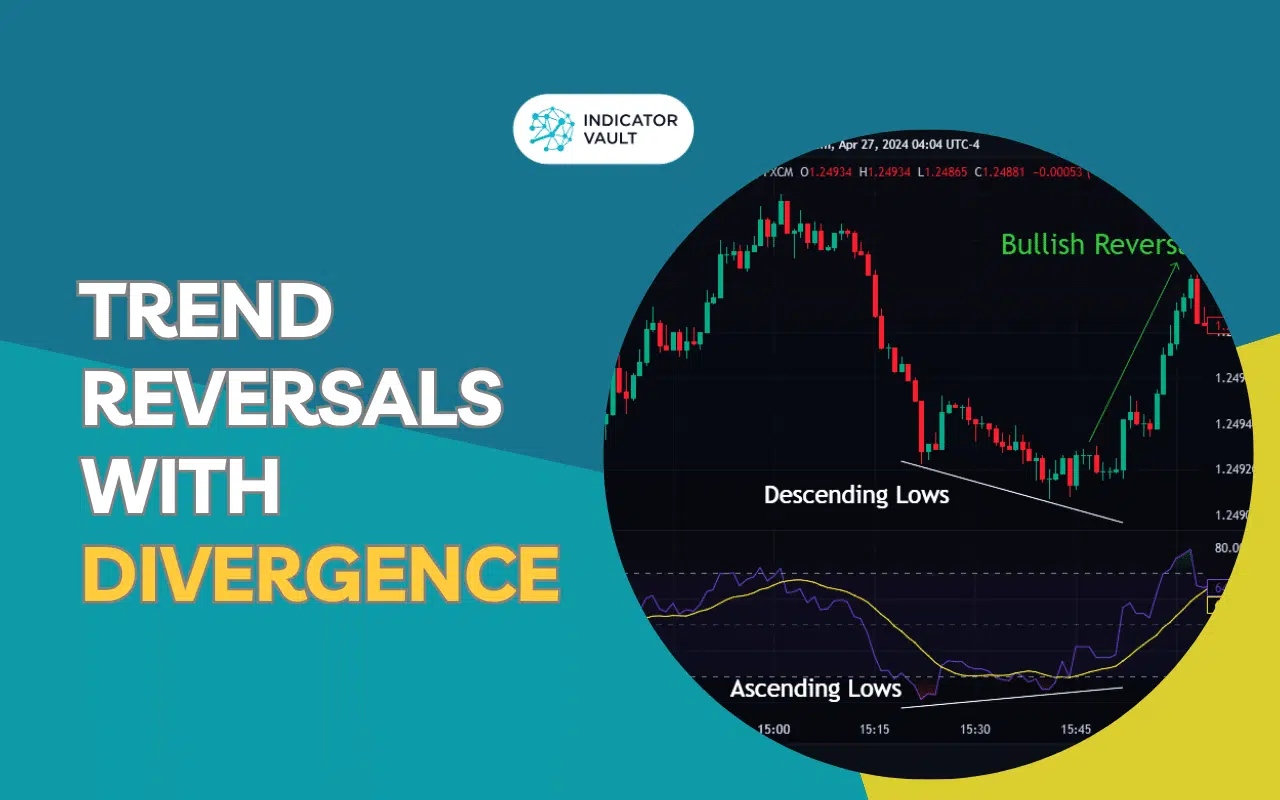
Bullish divergence refers to a reversal from a bearish to a bullish trend. Swing lows from each entity are responsible for such developments.
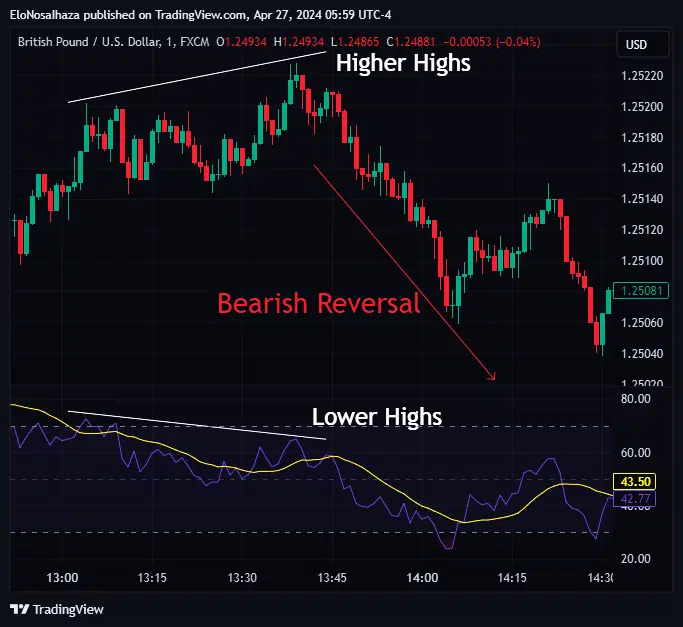
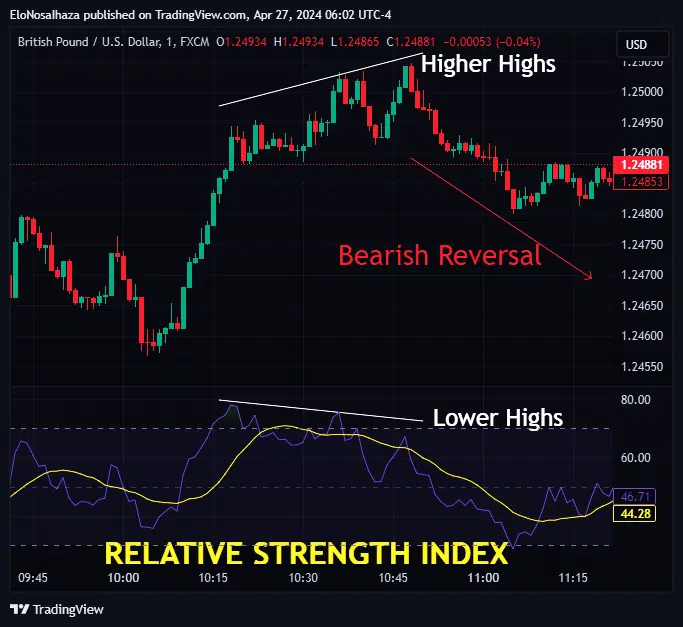
Conversely, bearish divergences signal potential reversals from an uptrend to a downtrend.
The rising price forms higher/lower swing highs in one entity than the other.
Based on the related entities used for divergence, traders can also classify it in the following ways:
Price-indicator divergence is the most popular and usually discussed whenever ‘divergence’ is used. It involves any interested market’s price and a technical indicator, such as the MACD, RSI, or Stochastics tracking it.
Bullish and bearish divergences occur when there is a discrepancy in highs or lows.
True to its name, price-price divergence involves two closely related assets. Such relationships may exist within or outside one financial market.
Like most trading disciplines, analysis with divergence theories must follow particular guidelines for optimal results. Below are a few such:
The closeness between the markets and indicators involved is the pillar of divergence. Thus, it must be obvious & indisputable in any pairing.
A famous example is the S&P 500 Index and Nasdaq-100. Similarly, EUR/USD and GBP/USD pairs show such relationships in the Forex market.
During comparisons (especially in price–price divergences), traders must always utilize similar timeframes on both charts.
For example, a scalper’s study between two closely related currency pairs in one session must be in M1 charts or M5 charts, not both.
It ensures maximum correlation between the entities for peak analysis and forecast.
Divergence analysts should only consider the swing highs and lows formed in the same period.
For instance, traders can’t utilize a high/low that develops in one entity hours after manifesting in the other for divergence comparisons. Instead, the time difference, if any, between the formations in both should be closer to be considered.
For the most experienced traders, divergence is only a part of a more detailed trading strategy. Such plans may involve technical indicators, candlesticks analysis, chart pattern analysis, etc. Newbies can also copy this approach and seek more confirmations from independent parameters for improved forecasts.
Although divergence trading is undoubtedly one of the most straightforward strategies for reversals, it is by no means flawless for many reasons.
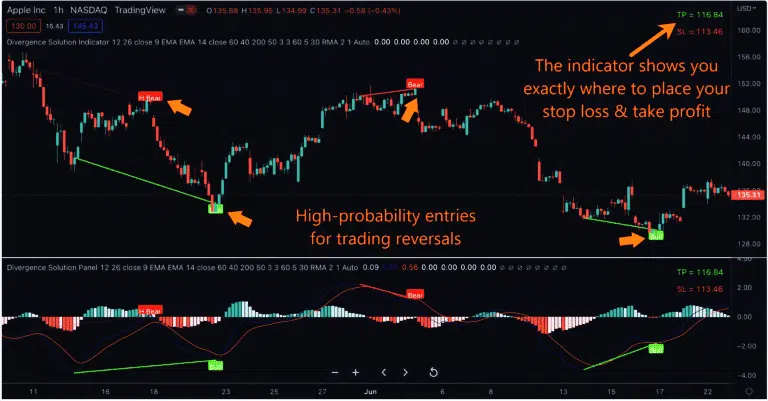
Indicator Vault’s Divergence Solution for TradingView has become a long-awaited panacea to most potential setbacks. Its ‘Triple Confirmation’ algorithm reveals the highest probability reversal opportunities from divergences.
In short, users get to enjoy the following benefits:
Doubt these? Click here now and brace yourself to be amazed by the results!
Reversal trading with the divergence can be fulfilling. The ease of spotting and executing it is almost unmatched.
However, the imperfection of its forecasts makes Divergence Solution for TradingView the most recommended method to approach divergences. It is completely automated, providing only the best opportunities from a ‘Triple Confirmation’ algorithm.
Please share this article among friends and trading enthusiasts for increased insights into reversal trading with divergence. Also, leave a comment below for educative discussions from experts.

Learn what a reversal pattern is, explore common bullish pattern and bearish pattern setups, and discover how Top Bottom Reversal helps traders improve reversal trading with earlier, clearer signals. Table of Contents 1. Introduction Every trader wants the same thing: to catch the turn before the crowd does. That is why reversal trading has always…

Volume surges reveal the turning points where trends begin to reverse. With Volume Force Pro, you’ll have the power to spot these critical moments and capitalize on them—trade after trade. Table of Contents 1. The Secret Behind Every Successful Trade? Volume Surges Market reversals can be your golden ticket to massive profits—if you catch them…

Most scalpers fail because they trade against trends and can’t spot real overbought/oversold conditions. If you’re a scalper tired of losing money on bad trades, this solution changes everything. Table of Contents 1. Stop Losing Money on False Breakouts and Bad Timing In Scalping If you’re like most scalpers, you’ve probably experienced this nightmare scenario…

Table of Contents Candlestick reversal patterns are one of the fastest ways for traders to develop an edge trading the market. If you haven’t heard of this pattern and its common types before, no pressure there! Indicator Vault has compiled the most fundamental information for you to visualize. 1. What is a candlestick reversal pattern?…

What are order blocks, and why do many traders use them to identify institutional trading activity? In this guide, we explain what are order blocks in trading, how they form on charts, and how traders use them to find potential support, resistance, and high-probability setups. Table of Contents 1. What Are Order Blocks? A trading…
Powered by a volatility-based algorithm, the Pullback Factor Indicator detects when pullbacks end, helping you trade confidently without second-guessing. Table of Contents 1. What is exactly a pullback? In trading, a pullback refers to a temporary reversal in the direction of the price movement within a larger trend. Imagine a mountain climber ascending a steep slope:…