A Bollinger Bands strategy is one of the most reliable technical approaches in modern trading, yet only a few traders truly understand how to use it correctly. Mastering a structured Bollinger Bands strategy can transform the way you analyze volatility, trends, and reversals across any market.
Table of Contents
1. Introduction
Many technical analysts have testified to the brilliance of John Bollinger’s work. While the indicator may seem complex or overwhelming at first glance, understanding how to build a proper Bollinger Bands strategy can turn it into the missing piece of your trading system.
This guide explains the structure, calculations, and practical uses behind a powerful Bollinger Bands strategy, along with an advanced development that enhances its performance in live markets.
2. Understanding The Elements Behind a Bollinger Bands Strategy
1950-born John Bollinger introduced this volatility-based indicator in the 1980s. Since then, it has become a foundation for countless trading systems built around a structured Bollinger Bands strategy.
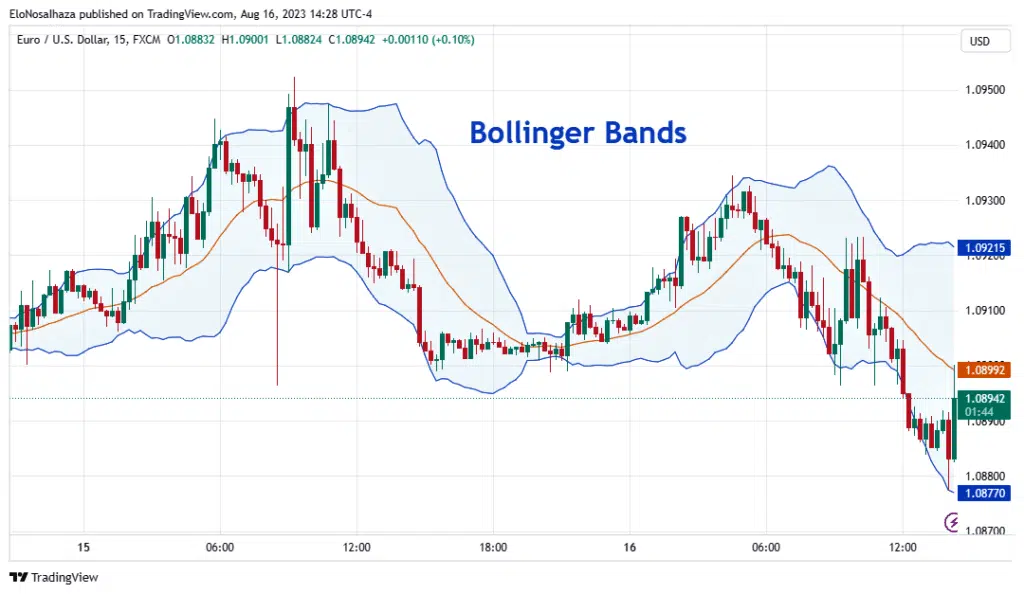
As shown above, most trading platforms plot the indicator on the price chart. It may feel distracting for first-timers, but everyone gets used to it over time.
Here are the three major parts you’ll discover from the basic version John Bollinger constructed:
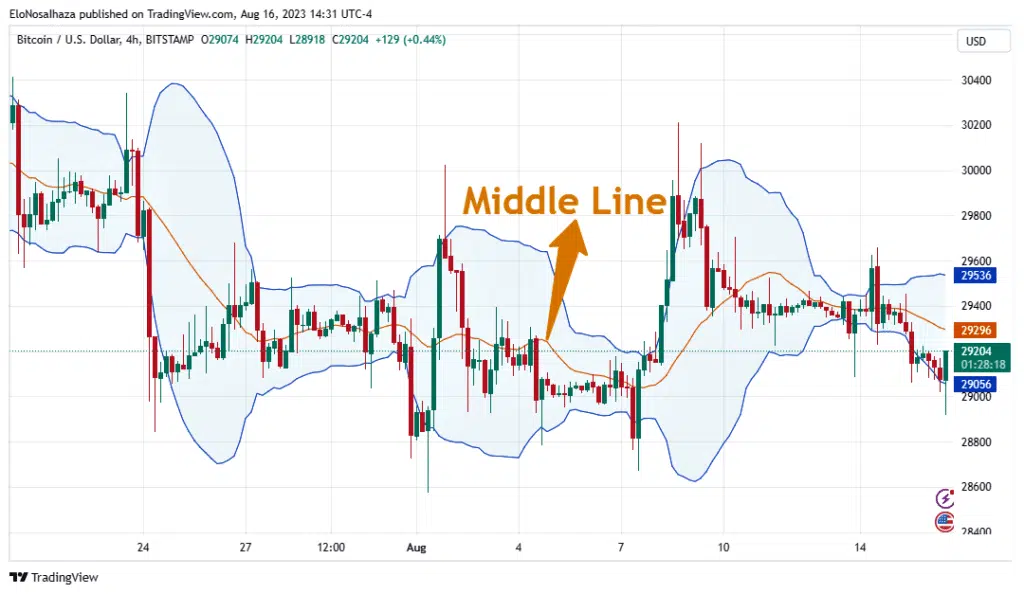
2.1 Middle Line
The Middle Line in the indicator is usually a Simple Moving Average (SMA) of a particular period.
Technical analysts generally embrace the 20-period line Bollinger first used, but most trading platforms allow users to tweak it. The Upper and Lower bands will use any period you eventually settle for calculations, so exercise caution when altering this.
This moving average acts as the base of any Bollinger Bands strategy, representing the equilibrium price level around which volatility expands and contracts.
2.2 Upper Band
As discussed, the Upper Band is a product of the Middle Line. It forms by adding a particular number of standard deviations to SMA’s period.
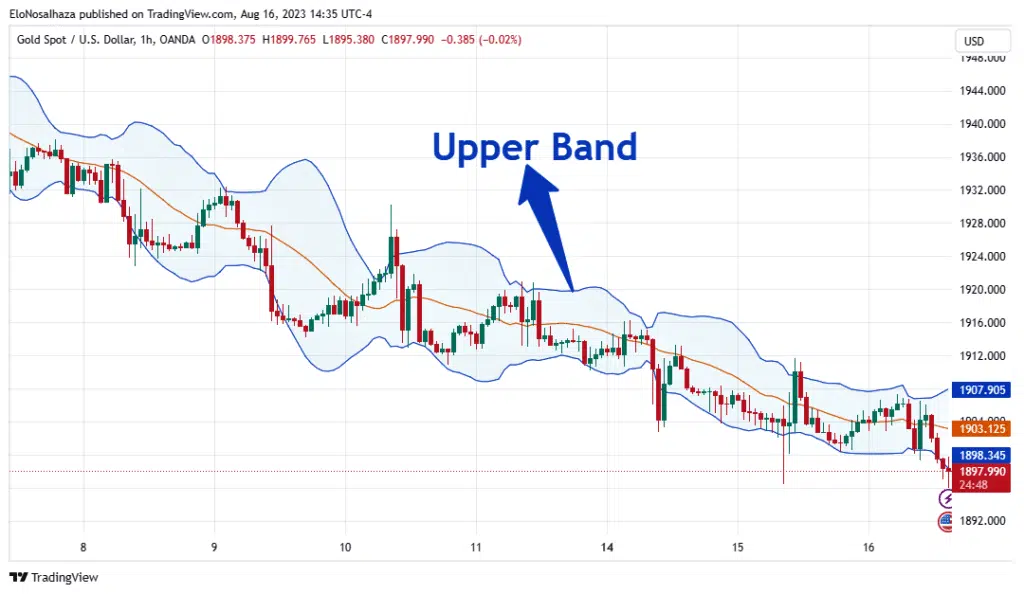
Here’s the mathematical representation:
Upper Band = (MA + Kσ)
Where,
MA = Moving Average
K = Multiplier of the standard deviation
σ = Standard deviation
As first calculated by Bollinger, the most common value of K is 2, making the Upper Band appear two standard deviations above the Middle Line – a key component in defining overextended conditions within a Bollinger Bands strategy.
2.3 Lower Band
The Lower Band is the direct opposite of its upper counterpart. Hence, it results from subtraction and not the addition of some standard deviations of the Middle Line.
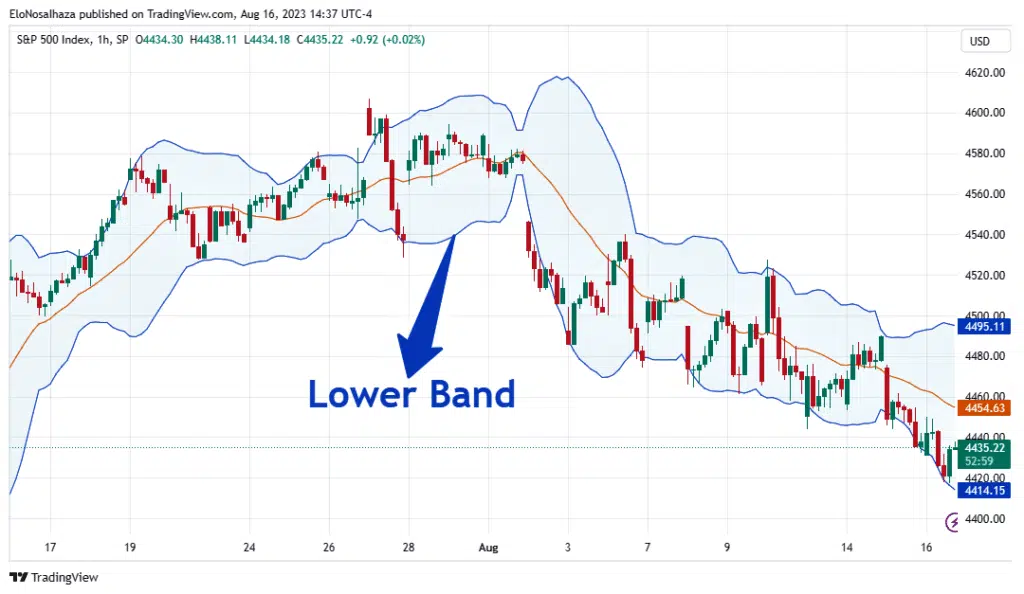
Mathematically,
Lower Band = (MA – Kσ)
K is also typically 2 in the calculation, resulting in the two-standard deviation lower position of the bands.
This symmetrical structure allows a Bollinger Bands strategy to identify price compression and expansion zones efficiently.
3. Practical Applications of a Bollinger Bands Strategy
Traders apply a Bollinger Bands strategy in several practical ways depending on their market style and objectives. Some cherish it as a solo forecast tool, while others only study it to understand prices’ historical nature.
In a nutshell, below are the most popular direct applications of the indicator thus far:
3.1 Volatility Assessment
The original purpose behind developing a Bollinger Bands strategy was volatility measurement.
Being an options trader in the ’80s, John Bollinger experienced these conditions several times. Hence, he needed a trusted method to analyze them for more informed decisions.
Based on the calculation, the wider the bands get, the higher the volatility. Conversely, the more it contracts, the less the volatility.
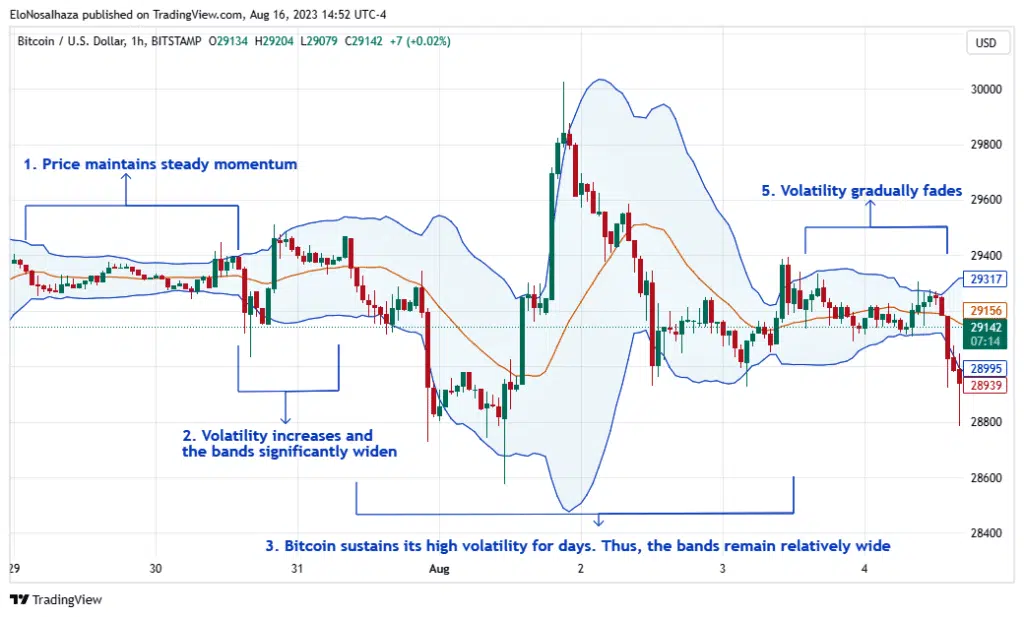
Pro traders prefer to sit out trading during highly volatile periods until it becomes more auspicious.
Many traders use this contraction phase as preparation for potential breakout trades — a core principle of any volatility-based Bollinger Bands strategy.
3.2 Trend Identification
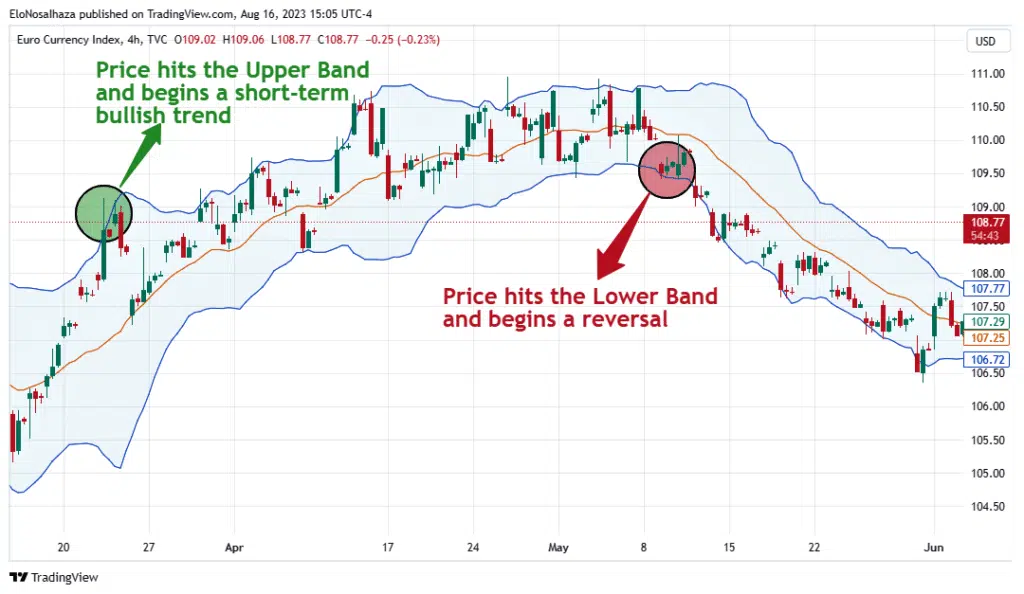
A Bollinger Bands strategy can also help identify underlying trends.
Devotees to this idea believe that the conditions are bullish when the candlesticks continuously trade near the Upper Band. On the other hand, a downtrend may be underway when the price hovers around the Lower Band.
Perhaps, this may not be so effective when used alone. Thus, it’s better combined with other trading concepts.
It can play a huge role in any strategy when used adequately.
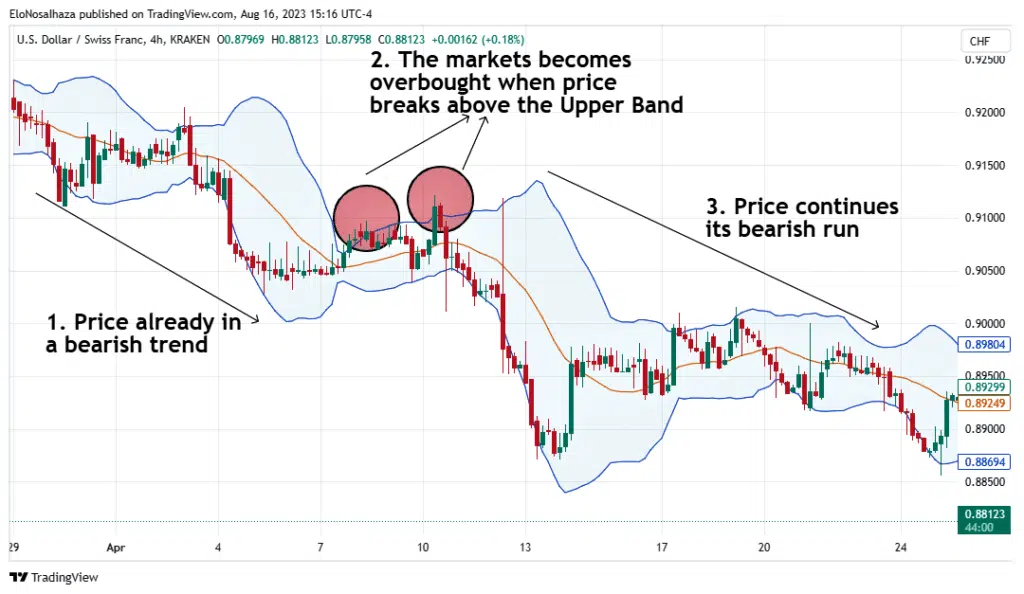
3.3 Overbought and Oversold Conditions
A general trading concept states that when market prices are overbought, one should expect a bearish reversal. Similarly, when they are oversold, a bullish reversal is imminent.
How can you tell when these periods are manifesting with Bollinger Bands?
Investopedia discussed it in great detail, but concisely, you only anticipate a break out of the bands. It relies on the concept of mean reversion of an asset’s price.
When the candlesticks break above the Upper Band (especially in a bearish market), the market is overbought. Conversely, it is overbought and set for a reversal when its breaks below the Lower Band.
4. The Ultimate Bollinger Bands Strategy
When introducing the indicator, John Bollinger never advised any trader to use it as a standalone trading plan.
Instead, a refined Bollinger Bands strategy combines uncorrelated tools like RSI, MACD, or volume-based indicators for confirmation.
For this ultimate strategy, Indicator Vault has combined the power of MACD and Bollinger Bands to ensure you stay ahead of the curve.
The MACD Bollinger Pro for TradingView is the best trend identifier out there. It signals upcoming bullish and bearish conditions with the cross of a dotted line above and below the bands.
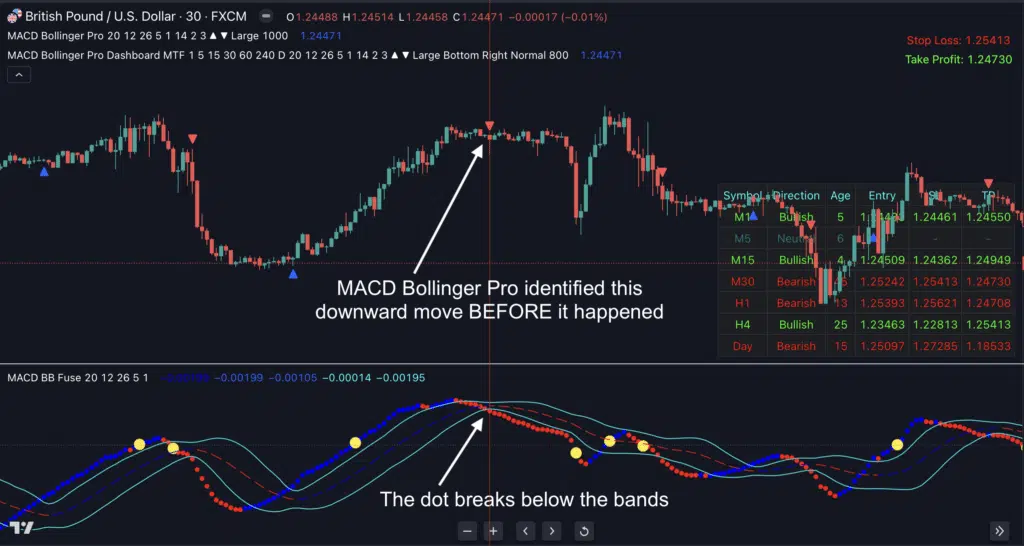
When it breaks above or below the Upper and Lower Bands, an uptrend or a downtrend is imminent, respectively. The trend is neutral when the dots remain between them.
Concisely, here are some significant benefits users get from it:
- Ease of entering potential trends at the earliest stage
- Knowledge of when the price is in a neutral/consolidation phase
- Flexibility to trade any instrument in any timeframe desired
- Ability to customize the indicator to your taste
This evolution takes the traditional Bollinger Bands strategy to a more systematic, professional level.
Seems like a dream come true? Click here now to discover more about this game-changing trading system.
5. Conclusion
A structured Bollinger Bands strategy remains one of the most respected methods in technical trading.
Traders use the indicator to analyze prices’ volatility, discover overbought and oversold levels, and identify potential trends. However, the most recommended strategy is with Indicator Vault’s MACD Bollinger Pro for Trading View.
You can share your results with it below in the comments section for more engaging chats.
Everyone deserves a winning strategy. Thus, feel free to pass this content on to friends and colleagues on social media.