Table of Contents
1. What is a gartley pattern in trading?
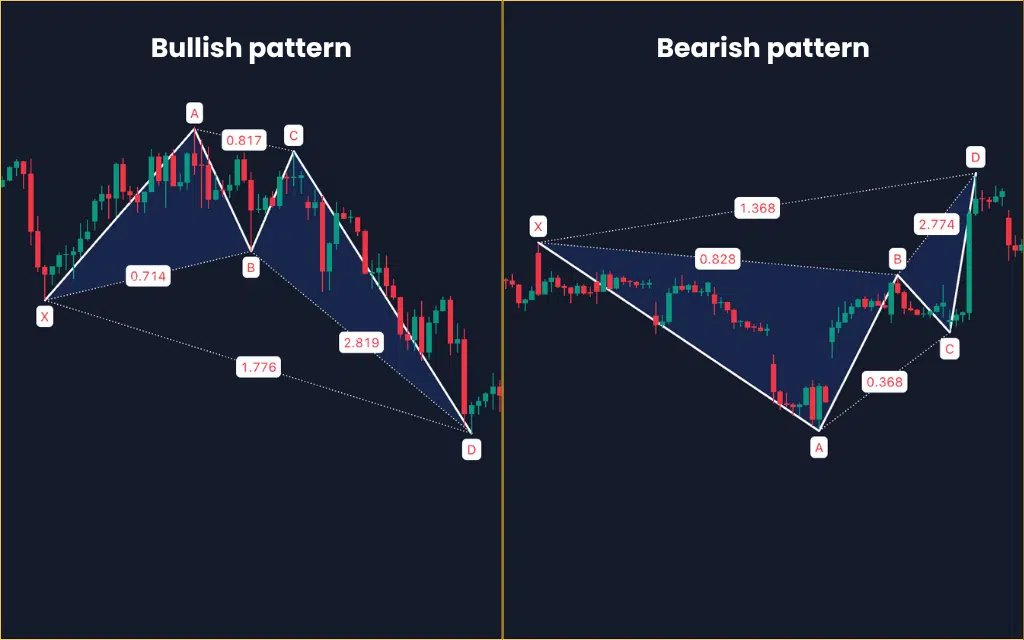
The Gartley pattern is one of the most widely used harmonic price patterns in technical analysis. It’s a precise 5-point chart formation (X-A-B-C-D) that signals a potential reversal at point D.
Traders love the Gartley because it combines price structure with Fibonacci ratios, giving them a high-probability turning point, not just a guess.
A bullish Gartley forms when price completes a corrective pullback and is ready to reverse higher; a bearish Gartley appears when price rallies into exhaustion and is likely to reverse downward. When used correctly, it offers powerful risk-reward setups because you’re entering near the beginning of the new trend.
But here’s the truth:
Spotting a correct Gartley pattern manually is extremely hard.
You need accurate Fibonacci measurements, strict ratio validation, and confirmation that price completed the D-leg perfectly. That’s why many traders misidentify the pattern and lose trades.
2. How to identify and trading with Gartley pattern
2.1 Identifying the Gartley pattern manually
To spot a valid Gartley pattern by hand, you must check:
- XA: The initial impulse leg
- AB: Retraces 61.8% of XA
- BC: Retraces 38.2% – 88.6% of AB
- CD: Extends to 78.6% of XA
Once price reaches the D-point, traders expect a reversal entry. Stops typically go beyond X, and take-profit targets are often Fibonacci extensions of CD or retracements of AD.
The problem?
You must measure every leg perfectly, confirm ratios, and ensure the pattern is not malformed. Doing this across multiple charts and timeframes is nearly impossible without automation.
2.2 Level up with a new pro tool
This is where Harmonic Pattern Pro for TradingView comes in.
Instead of spending hours drawing patterns manually, this tool automatically detects the Gartley pattern in real time across all markets – Forex, Crypto, Stocks,… and all timeframes.
It also:
- Validates every Fibonacci ratio automatically
- Highlights bullish/bearish patterns clearly
- Alerts you the moment a new pattern is completed
- Helps you avoid false or incomplete patterns
In other words, it does 100% of the heavy lifting for you.
3. The power move: Harmonic Pattern Pro indicator
3.1 Real Gartley pattern example in Forex trading
The true power of the Harmonic Pattern Pro is realized in live market application. Consider this recent, high-precision setup on the NZD/JPY pair:
The Harmonic Pattern Pro indicator instantly detected a bullish Gartley pattern, signaling a high-probability reversal and confirming a timely long entry opportunity.
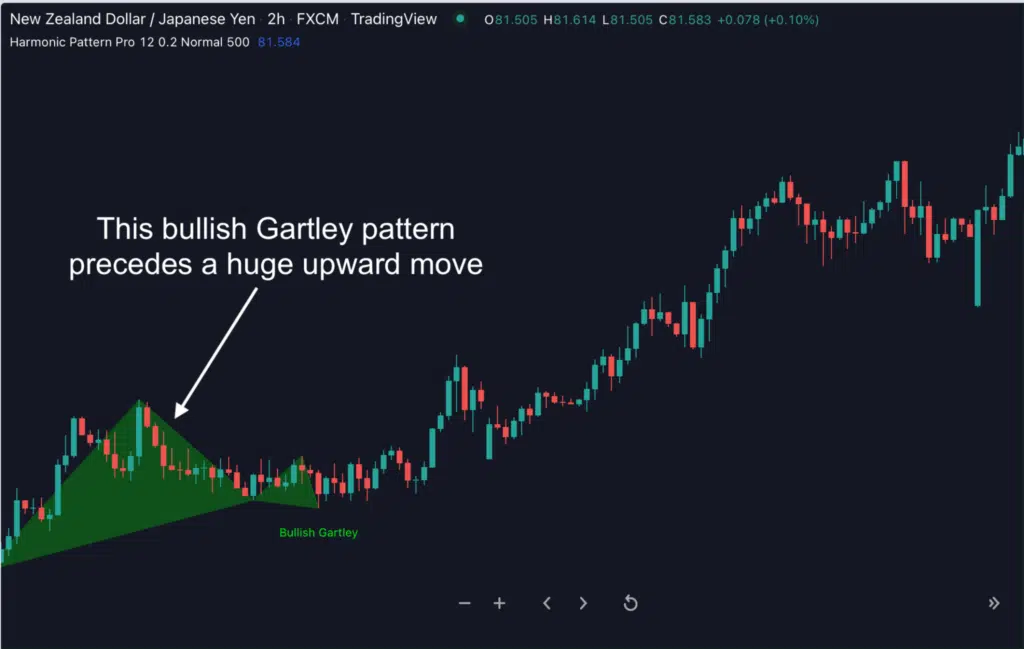
Price reversed almost immediately, right when you expected it to. This quickly triggered your entry.
Then, by using a simple trailing stop (for example, 3 × ATR), you can capture a large portion of the new uptrend, locking in that profit exactly as the pattern intended.
3.2 Other harmonic patterns every trader should know
The Gartley is only one pattern. Serious harmonic traders must also understand the other major reversal patterns.
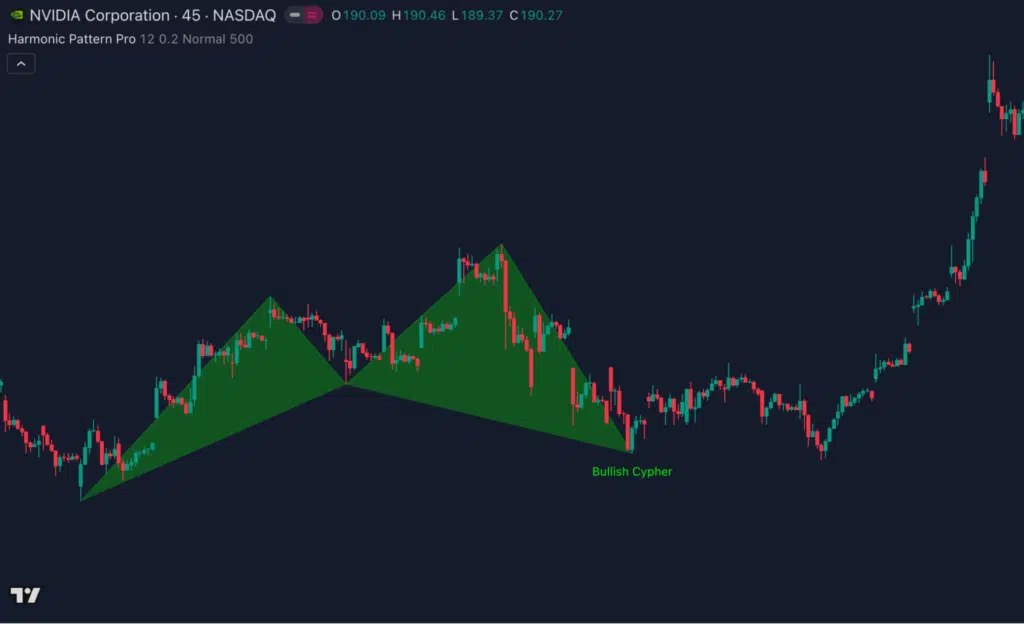
Harmonic Pattern Pro indicator automatically detects all six of the most popular patterns: Gartley pattern to Butterfly, Crab, Bat, Cypher to Shark.

Forget manual measuring. With this tool, you conquer complex patterns and enter highly precise market reversals with confidence, all while keeping your charts clean.
4. Conclusion
The Gartley pattern is one of the highest-probability reversal structures in technical analysis, but only if identified quickly and correctly. Doing it manually is slow, complex, and prone to costly mistakes.
That’s why thousands of traders rely on Harmonic Pattern Pro for TradingView. It not only detects the Gartley, but other 5 common harmonic patterns are shown clearly on your chart in just 5 seconds.
If you trade harmonic patterns, or want earlier, more reliable reversal signals… This tool is built for your trading success.