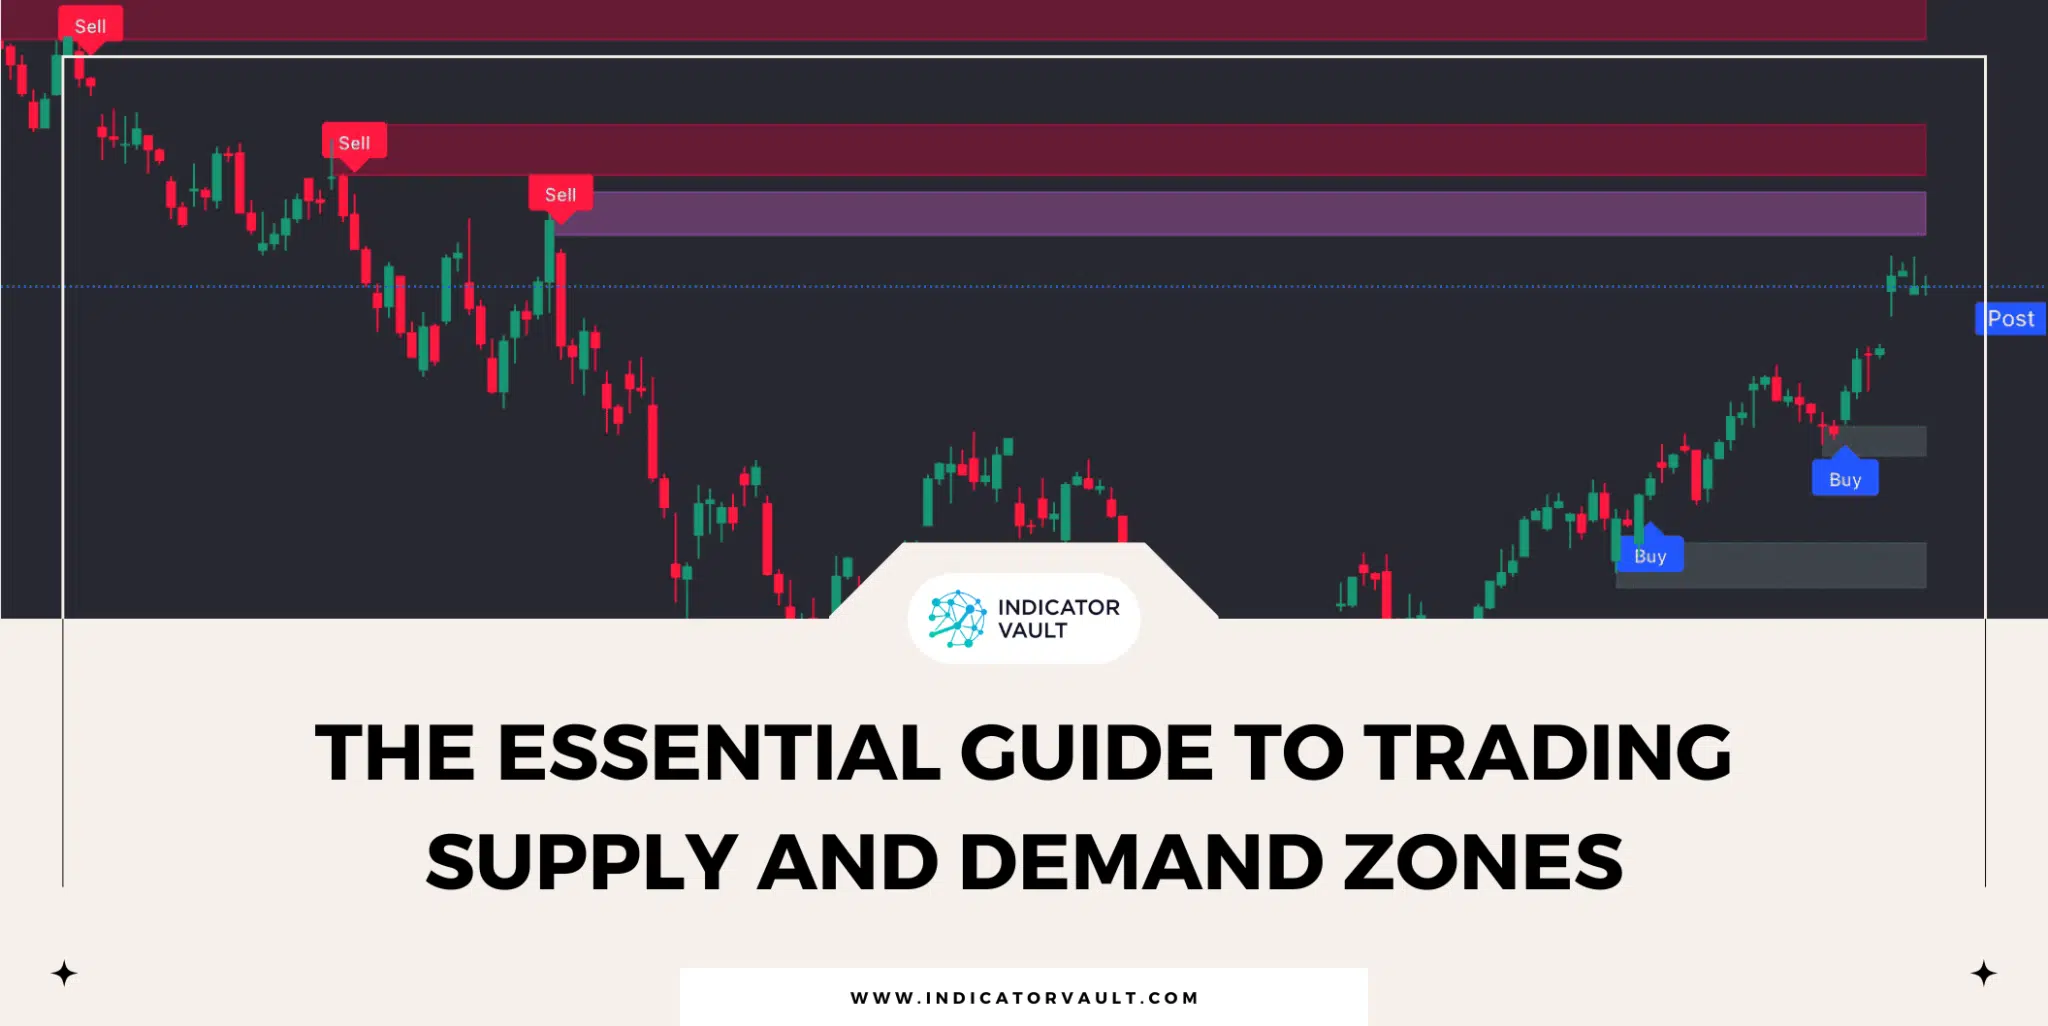
On a price chart, supply and demand zones show areas where an asset’s price has met strong resistance or support. These zones might help traders forecast where an asset’s price is likely to change direction.
Table of Contents
1. What are Supply and Demand?
Supply and Demand are two of the most important economic concepts. They show the quantity of a good or service that is available (supply) and the quantity that people are willing and able to buy (demand).
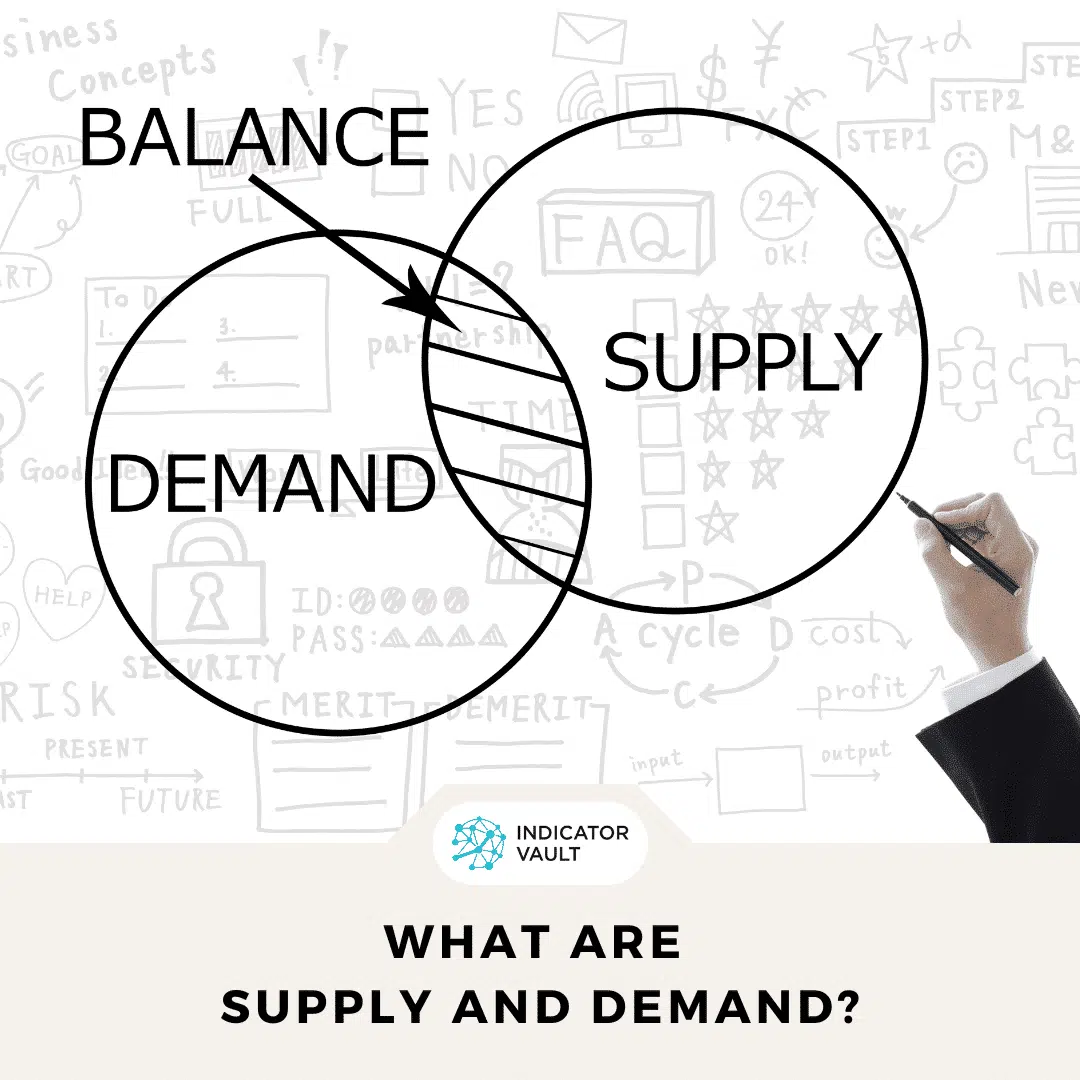
In financial markets, the supply and demand for a security or commodity can have a significant impact on its price. Strong demand may drive up the price of an asset, especially if there is a shortage of that asset on the market. In contrast, an asset’s value may fall if demand is low and there is a surplus of supply.
2. Supply and Demand Zones
2.1 Supply Zones
A supply zone describes a region in which there is an excess of an asset, such as a stock, bond, or commodity. With more sellers than buyers, the price of the item may fall due to the surplus of supply.
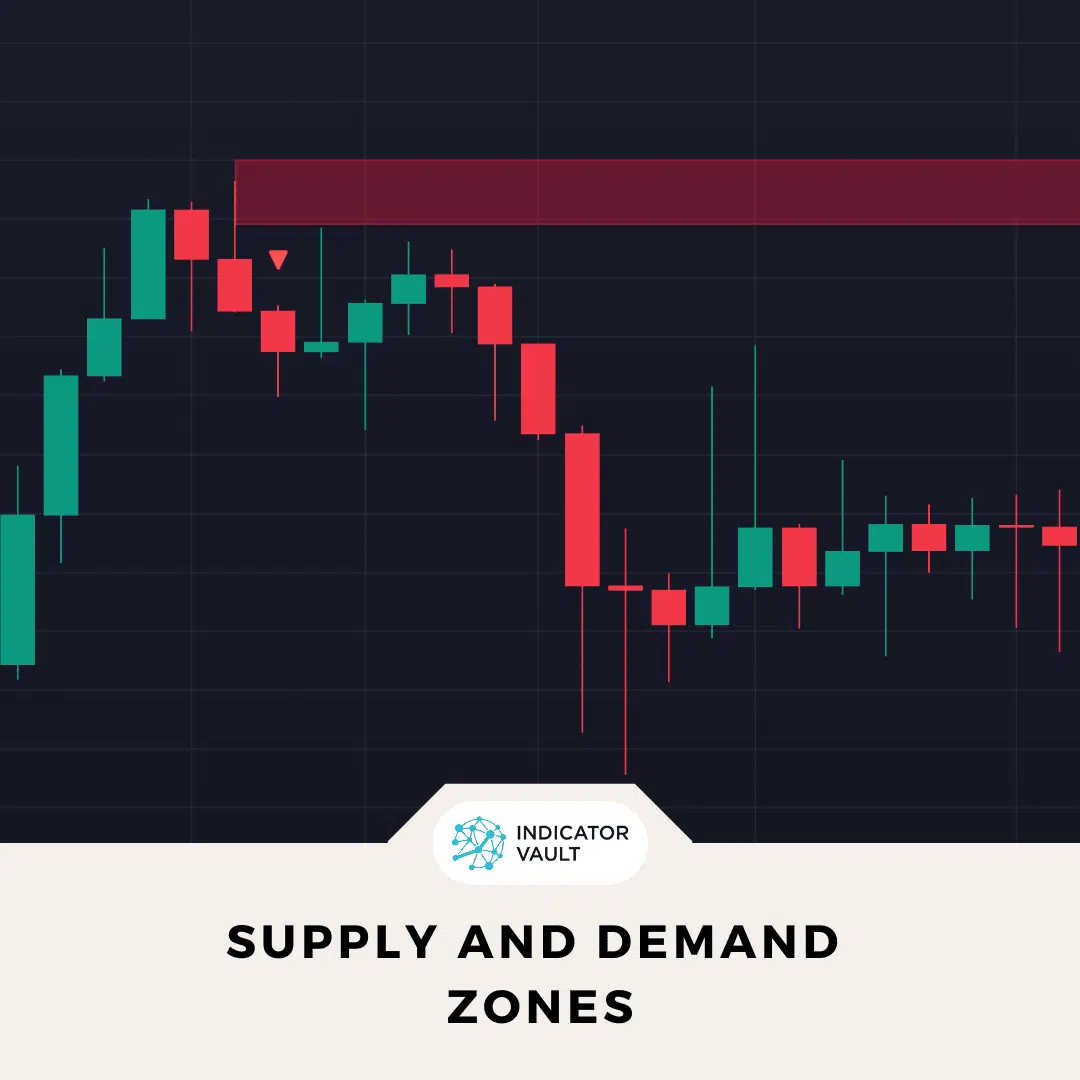
On the chart, the candlesticks or bars that signal the beginning of a significant downtrend are referred to as the supply zone or distribution zone.
2.2 Demand Zones
A demand zone, on the other hand, is an area in which there is a strong demand for an asset but a limited supply. Since there are now more people interested in buying the item than there are people willing to sell it, the price may rise as a result of this shortage of supply.
The demand zone or accumulation zone refers to the series of bars or candlesticks on the chart that mark the beginning of a strong uptrend.
3. How do Supply and Demand zones form?
Once the price of an asset reaches considerable levels of resistance or support, supply and demand zones form. Resistance levels are price points where demand is strong enough to stop the price from going up, establishing a supply zone. A demand zone forms at support levels, when buyer interest is high enough to keep prices from falling any further.
Supply and demand zones are sometimes referred to as accumulation and distribution zones, which come from Wyckoff’s explanation of market price action. Richard D. Wyckoff was a pioneer in the field of technical analysis, and his ideas and techniques are still widely used today.
Wyckoff explained that the action of “whale”, a.k.a. big institutions like money center banks or hedge funds will create a supply or demand zone on the chart.
The whale can’t immediately flood the market with their full orders, since doing so would cause a quick rally in price and cut into their earnings. To reduce the market effect of their deals, they sell or buy over time instead, which establishes these zones.
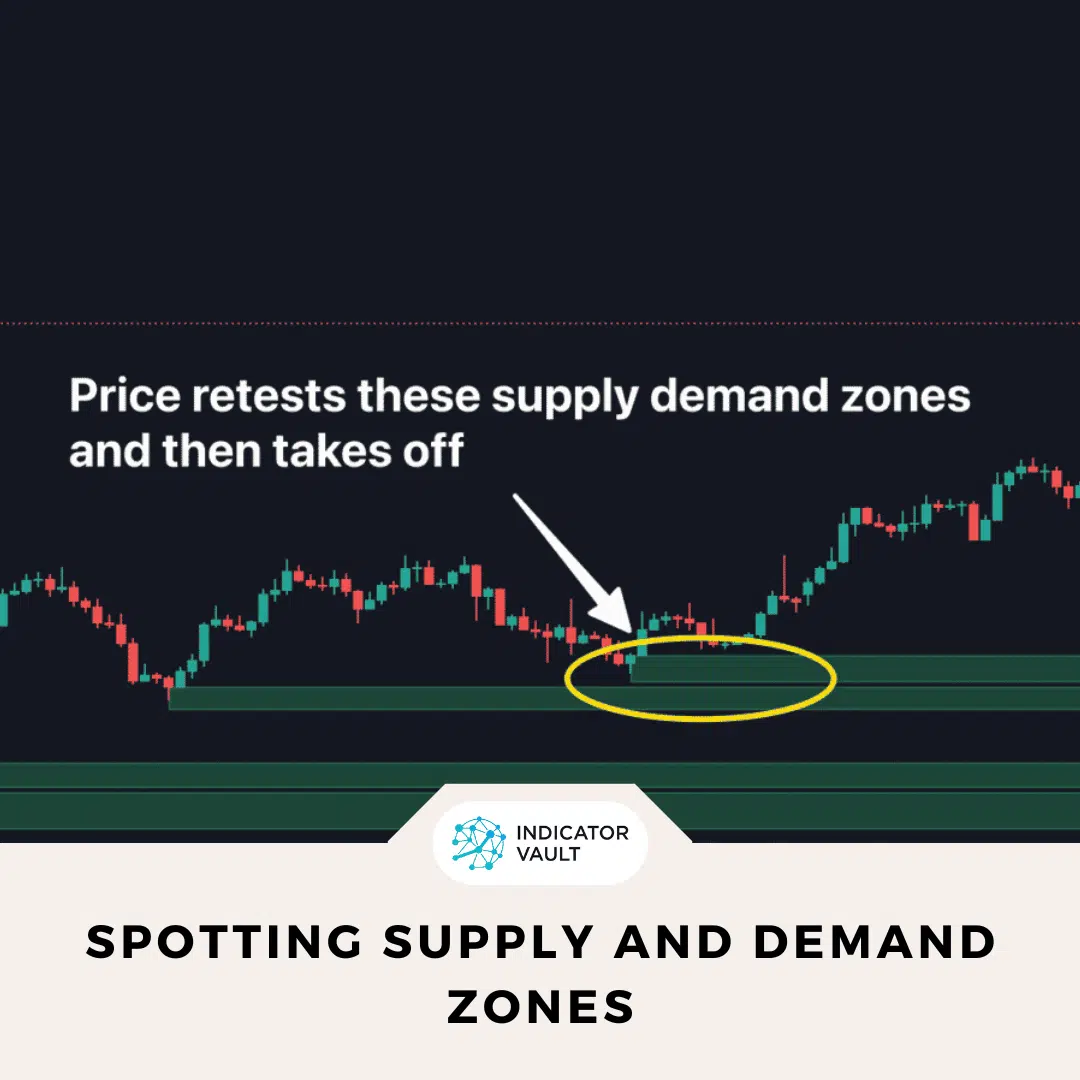
4. Spotting Supply and Demand zones
It takes a lot of effort to draw supply and demand zones. In short, you need to identify the most recent swing high and swing low on the chart, and mark areas of significant resistance and support. Then connect the swing highs and lows with horizontal lines to create these zones.
It’s also important to note that marking supply zones and demand zones is a subjective process. Therefore, invalid zones detected may affect traders when identifying trade setups using these zones.
It is recommended to use a tool to spot supply and demand zones to save time and guarantee accuracy. One of the best supply-demand indicators you can use is the Supply Demand Pro for TradingView by Indicator Vault.
With this indicator, you can:
- Detect all the strongest supply and demand zones for you.
- Use these supply demand zones as BOTH entries and exits.
- Get timely alerts and suggested stop loss and take profit.
A great tool for identifying precise supply zones and demand zones and saving time to find more good trade setups.
5. Trade with Supply and Demand zones
You can use supply and demand zones to forecast when an asset’s price is likely to change. For example, if the price of an asset is reaching a supply zone, a trader may predict that the price would decline due to excess supply.
In some cases, retests of support and resistance zones might be profitable trading opportunities.
5.1 Use the zone as an area to take profit
If you have a long position and the market price is moving into a supply zone, you may want to consider closing the trade and taking profit.
5.2 Look for a breakout from the zone
A breakout of a supply and demand zone might be seen as a buy or sell signal. A bullish breakout of a supply zone, for instance, may be seen as a sign of strength and prompt a trader to enter a long position.
5.3 Wait for a retest of the zone
The price may return to the zone to test the level of resistance or support after the price breaks out of a supply or demand zone. After a price moves through a supply or demand zone, it often retraces its steps to see whether support or resistance can be found there.
6. Conclusion
You may use supply and demand zones to your advantage when trying to predict price action and identify newly formed trading opportunities.
There are many ways to trade with these zones. You can use the Supply Demand Pro Indicator to find all supply zones and demand zones quickly and easily.
Also, follow us for all the promotions and other useful topics:
- Facebook: www.facebook.com/indicatorvault
- Instagram: www.instagram.com/indicator.vault
- Youtube: www.youtube.com/c/IndicatorVault