‘Market structure trading,’ a popular jargon in trading circles, may sound puzzling to newbies. Dive into this article today for its definition, types, & significance.
Table of Contents
1. Introduction
Market structure is one of the most reliable frameworks in technical analysis because it reveals the true rhythm of the market. Instead of reacting emotionally to every candle, traders who understand this strategy can see the underlying order beneath price movements and trade with confidence. Whether you’re identifying trends, timing entries, or anticipating reversals, market structure trading gives you a clear roadmap for what price is doing and what it is likely to do next. This concise article explores the definition, types, features, and its applications in trading. Readers will also enjoy exclusive access to an outstanding technical tool predicated on its principles.
2. What is market structure trading?
2.1. Market structure
Market structure is the natural pattern of swing highs and swing lows that price forms over time. By analyzing these structural points, traders can determine whether the market is in an uptrend, downtrend, or range.
In technical analysis, market movement refers to the arrangement or organization of an asset’s price at any given time. It enables traders to interpret past and current conditions, from appearance to performance.
Below are a few reasons for understanding the market structure trading:
- Better interpretation of asset prices based on current and previous actions
- Improved communication of ideas among technical analysts
- Increased insights for enhanced market forecasts
- Awareness of the most favorable/unfavorable periods to trade/avoid the markets
- Adaptation to various conditions for improved performance
Analyzing price structure typically involves identifying the underlying trend, support and resistance levels, chart & candlestick patterns, and trendlines.
2.2. Price action VS market structure trading
Although often discussed together, market structure and price action serve different roles. Market movement provides the overall framework, where the trend is, where momentum is shifting, and which side is in control. Price action focuses on the behavior of individual candles, patterns, and reactions at key levels. In other words, price action shows the details, while price structure shows the big picture. Effective market movement trading combines both, using structure to identify direction and using price action to time precise entries.
3. Typical phases of market movement in trading
Based on the results of such analysis, experts typically classify their findings in three ways:
3.1. Bullish market structure trading
A bullish structure features ascending price movement on the charts for a sustained period. The market forms higher swing highs and lows, indicating increasing strong investor confidence.
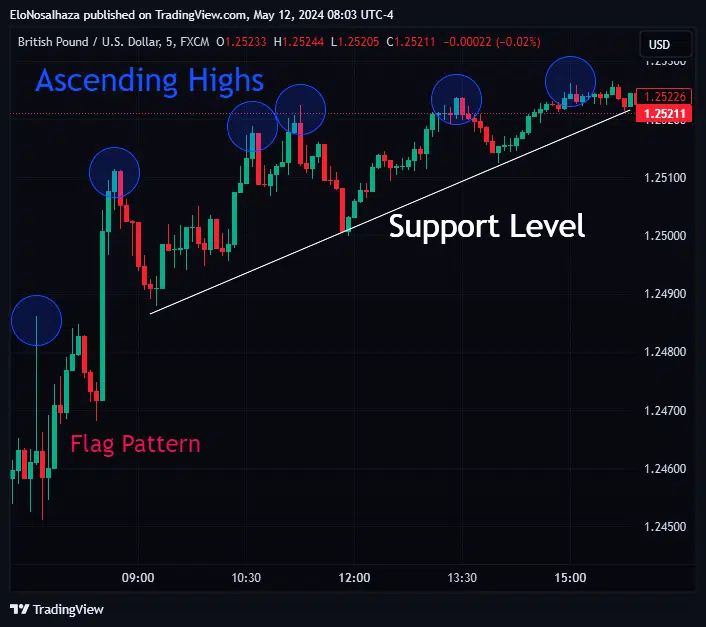
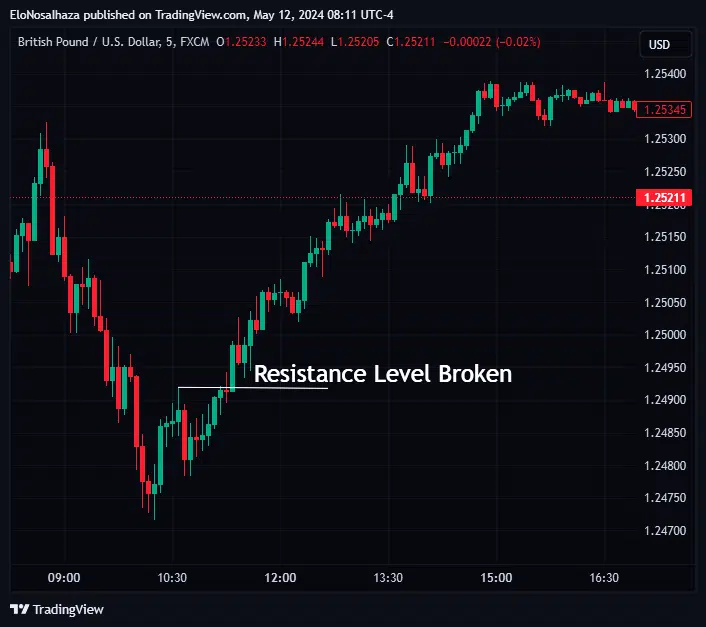
It develops new support levels as older ones become stronger during active hours. On the contrary, prices also break old resistance zones with momentum.
Chart and candlestick patterns in this structure typically back bullishness throughout the period.
3.2. Bearish market structure trading
The bearish structure is the reverse of the bullish structure. It features falling prices over time, breaking swing lows due to the increasing selling pressure, and decreasing investor confidence.
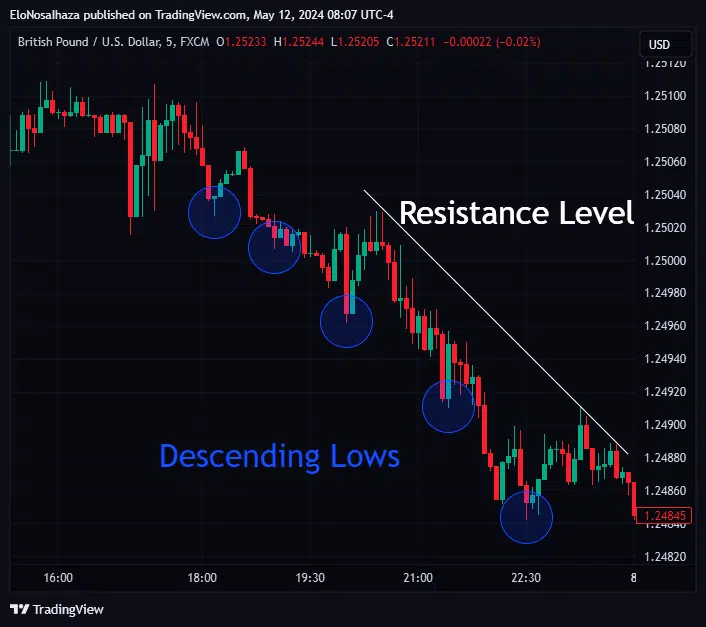
The resistance levels here are much more effective than the support zones (that prices break continuously).
Similarly, pattern trading in the bearish structure favors downtrends provided the structure remains unbroken.
3.3. Sideways market structure trading
In a sideways market, assets remain in ranging conditions. New swing highs form after new swing lows continuously, forcing a horizontal appearance on the charts.

Unlike bullish or bearish structures, the market breaks both support and resistance levels as often as possible while consolidating.
It is arguably the most unfavorable period for trading.
4. How does this strategy work in trading?
A financial market is always definable structure-wise at any time. As discussed, it may be bullish, bearish, or ranging.
When any of them approaches its terminus, a market movement break (or Break Of Structure) occurs, which is usually a transition to another framework. It is a violation of an established organization in the charts.
Break Of Structure (BOS) typically begins with a support or resistance level violation, depending on the trend.
For instance, a bullish structure featuring higher candlestick highs and violations of resistance levels will last for as long as fundamental factors permit. A break of this structure will be the case when the price falls below a significant swing low.

Likewise, a break of a bearish structure that features descending prices will occur when the price moves above a significant resistance level (usually a swing high).
Today, traders employ more technical and fundamental parameters to confirm (or refute) potential structure breaks.
Understanding and anticipating the BOS is essential for unlocking new opportunities, improving risk management techniques, or identifying the latest support/resistance levels.
5. Beating the Odds with Market Structure PRO for TradingView
Learning how the price structure works is one thing; profiting off it is another; many traders who make it to the former group struggle to be among the latter.
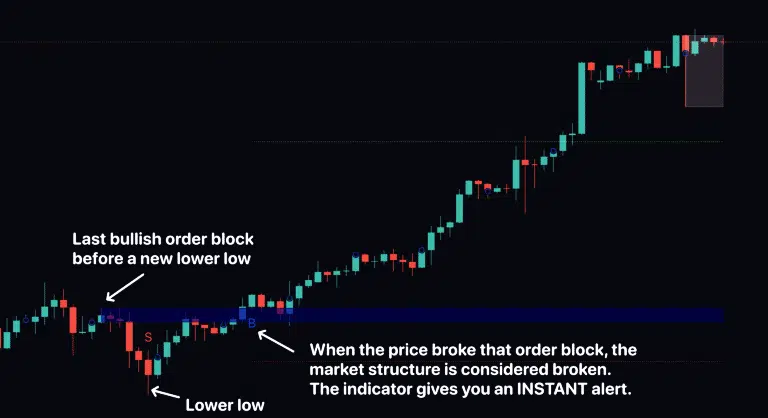
Fortunately, Indicator Vault has developed a powerful solution – The Market Structure PRO for TradingView. The technical indicator reveals the most elusive price structure breaks with reliable theories, including order blocks.
The Market Structure PRO in action
Here are a few benefits it offers every user:
- Awareness of the most influential price structure breaks
- Ability to leverage bullish or bearish reversal opportunities ASAP
- Knowledge of the best risk management practices, including where to place stop loss and take profit orders
- Freedom to explore any market or timeframe desired
Guarantee of market participation when desired, thanks to the timely TradingView alerts
6. The bottom line
At its core, this strategy is the foundation of all technical analysis. Understanding how bullish, bearish, and ranging structures form allows traders to read the market’s intentions and respond with precision instead of emotion. But manually tracking market movement in real time can be overwhelming.
That’s why Market Structure PRO is such a game-changer for market structure trading. It eliminates the guesswork, highlights structural patterns instantly, and gives traders a clear, unbiased view of what the market is truly doing.
If you want to sharpen your edge, simplify your analysis, and start trading in sync with real market behavior, mastering market structure and using Market Structure PRO for Tradingview, is the smartest path forward.