Despite trend lines analysis’ widespread nature, only a few technical analysts really make a killing with them. Explore this concise article today to be one in no time.
Table of Contents
1. Introduction
Trend lines remain one of the most powerful tools in technical trading. No true analyst is oblivious to their concepts, presence, and methodology. However, only a modest number boast of their efficiency in trading.
Despite trend lines’ widespread use in technical analysis, only a few traders truly profit from them. The difference isn’t in the concept itself – it’s in understanding three critical factors: proper validation, multi-timeframe context, and realistic risk management.
This article explores trend lines analysis and its basics with keynotes to consider when employing them. You’ll discover exactly how to draw, validate, and trade trend lines across all markets – from Forex to commodities and indices.
2. Trend Lines Fundamentals: Definition, Types, & Significance
Trend lines are one of the most popular, debated, and nearly “over-utilized” discoveries of technical analysis. They are lines connecting sensitive points in price charts for understanding the underlying trend (bullish, bearish, sideways) or support & resistance areas.
Hence, trend lines analysis entails drawing these straight lines in the markets (from Forex to commodities and indices) for potential trend forecasts. The market direction helps technical analysts stay informed on the current conditions to make the best decisions.
Below are the types of trend lines based on how they can appear:
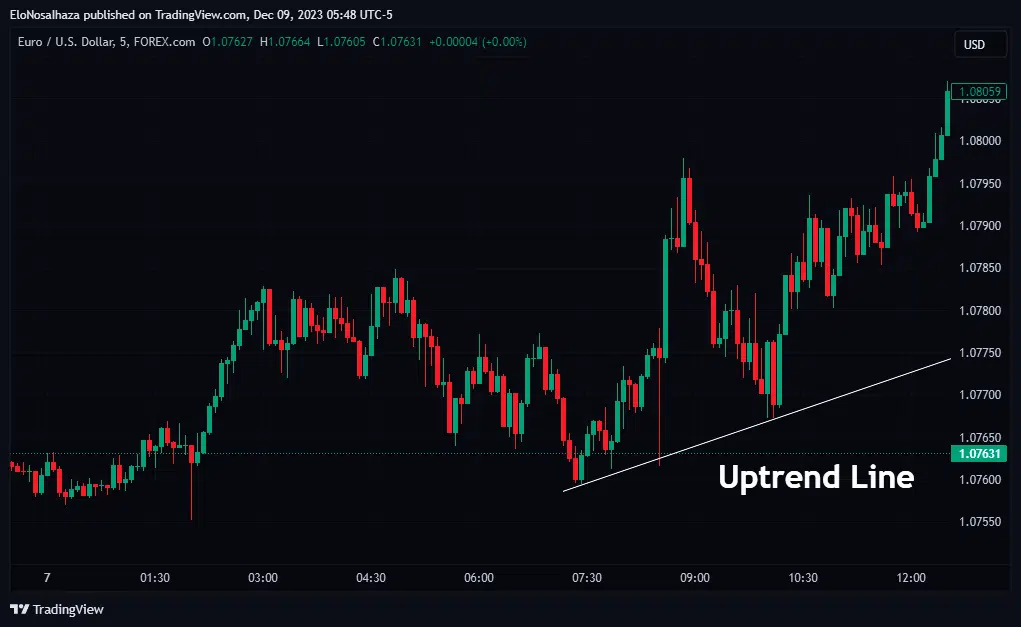
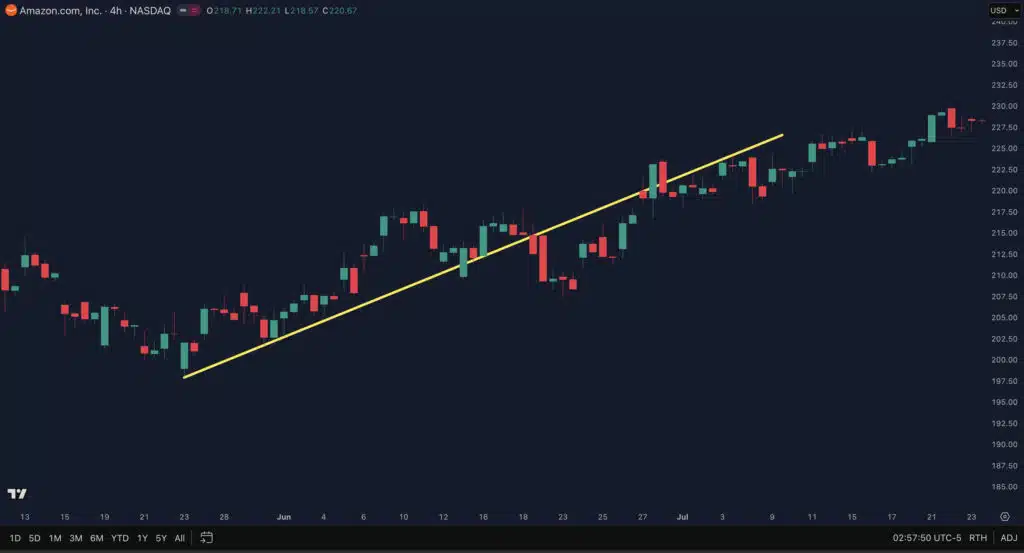
2.1 Uptrend (Bullish Trend) Line
True to its name, an uptrend line is an ascending line highlighting a bullish market. It connects the higher highs of candlesticks continuously until the trend switches.
The swing lows are also typically ascending when no significant market-moving event transpires. Hence, many traders favor having them below these lows like a support line.
There are no rigid rules about drawing uptrend lines.
Some price analysts prefer the lines to lean on the opening or closing price of the rising candle bars. Others continually adjust them after every new price data release.
Best Used For:
- Identifying buying opportunities during confirmed uptrends
- Works best on H4, Daily, and Weekly charts for swing traders
- Effective on M5-M15 charts for day traders catching intraday momentum
- Higher probability when combined with other bullish indicators
Common Trading Strategy: Many successful traders wait for price to pull back to the uptrend line, look for bullish reversal candlestick patterns (hammer, bullish engulfing), then enter long with stop-loss placed just below the most recent swing low – not just below the line itself.
2.2 Downtrend (Bearish Trend) Lines
Conversely, downtrend lines descend with the price, indicating bearishness. The slant drawings connect falling swing highs as long as the declining move lasts (like a form of resistance).
In many cases, the lows also descend uniformly throughout the trend period.
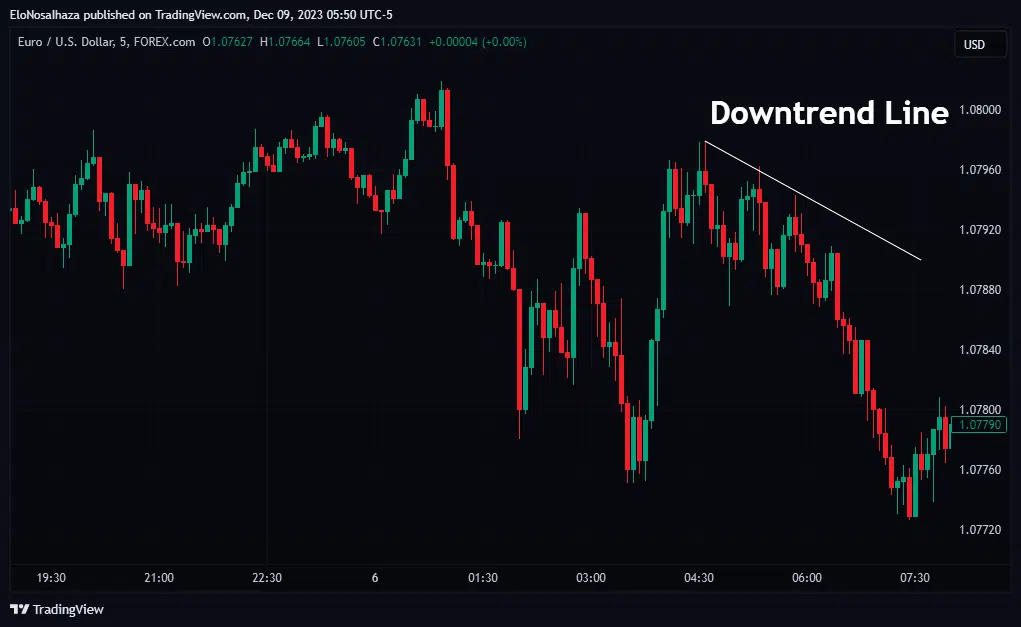
Downtrend Line example
Like bullish trend lines, technical traders can ignore the wicks to draw bearish trend lines that touch candlesticks’ bodies, and no one questions such decisions, especially when prices keep respecting them.
Best Used For:
- Identifying shorting opportunities during confirmed downtrends
- Excellent for bearish traders and short-sellers in trending markets
- Most effective when market sentiment is clearly negative
- Avoid in choppy or ranging conditions
Common Trading Strategy: Professional traders often wait for price to rally up to the downtrend line, observe rejection signals (bearish candlestick patterns like shooting stars or bearish engulfing), then enter short positions with stop-loss orders placed above the recent swing high for proper risk management.
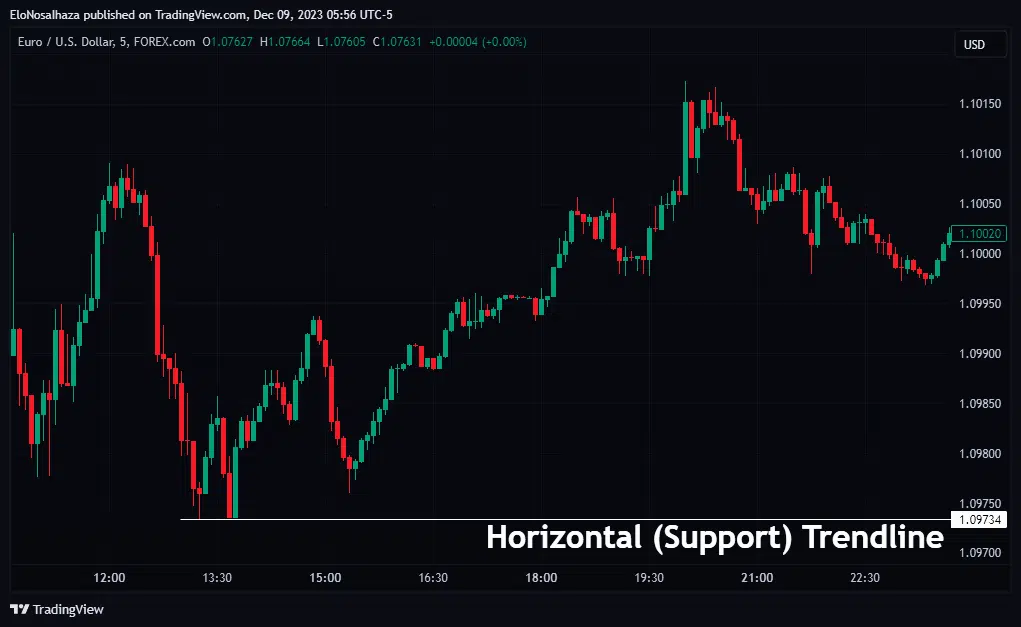
2.3 Horizontal (Support & Resistance) Trend Lines
Horizontal lines in the chart have proven significant in this technical analysis field. They mark levels where prices are supposed to find support (below) or experience resistance (above) against breaking beyond them.
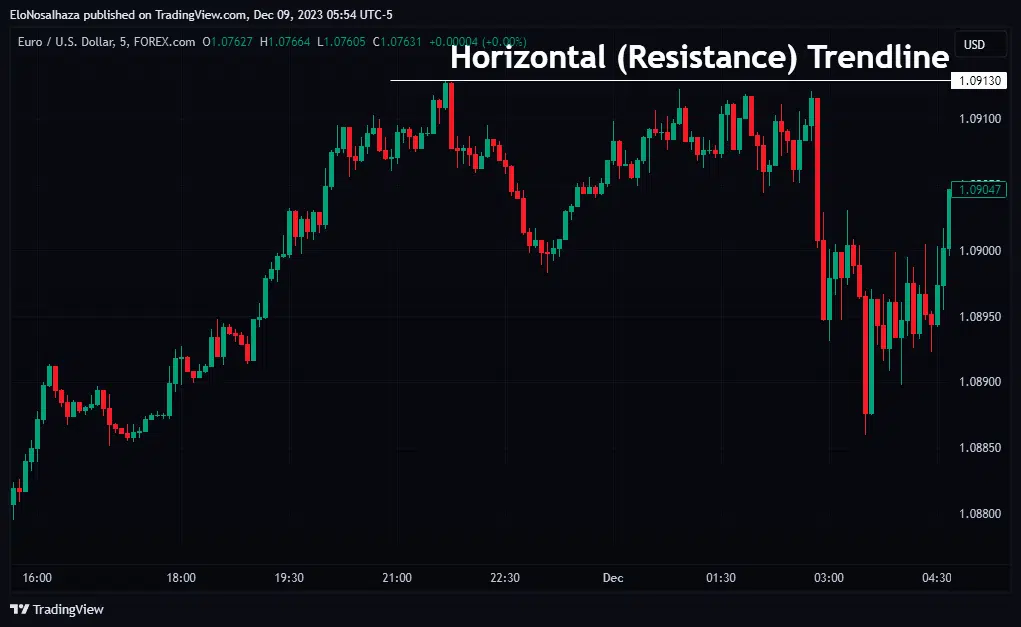
Traders identify them by observing chart levels that have prevented a price cross with past swing highs and lows. Hence, future price movement toward such areas may cause an anticipated reversal.
Prior experience with support and resistance levels is vital to draw and leverage horizontal trend lines.
Pro Insight: Horizontal levels often function as “zones” rather than exact lines. Price may penetrate 5-10 pips (in Forex) or 0.5-1% (in stocks) before reversing. This is normal market behavior—not a failed level. Always allow for this buffer zone when setting stop-losses.
When Horizontal Lines Are Most Powerful:
- In ranging/sideways markets
- At psychological round numbers (1.2000, 1.3000 in EUR/USD)
- When aligned with previous major swing highs or lows
- Combined with Fibonacci retracement levels (50%, 61.8%)
3. How to Draw Trend Lines: Step-by-Step Guide
While the previous sections explained what trend lines are, many traders struggle with the actual mechanics of drawing them correctly. Follow this systematic 5-step process:
Step 1: Identify the Prevailing Trend
Before drawing any line, determine the current market direction:
- Uptrend: Series of higher highs (HH) and higher lows (HL)
- Downtrend: Series of lower highs (LH) and lower lows (LL)
- Sideways: Price bouncing between horizontal ranges
Step 2: Locate Significant Swing Points
Find the most obvious turning points where price reversed:
- For uptrend lines: Look for swing lows (valleys)
- For downtrend lines: Look for swing highs (peaks)
- For horizontal lines: Find repeated reactions at specific price levels
What Makes a Swing Point “Significant”?
- Has at least 5-10 candles on each side showing clear reversal
- Represents a meaningful price move, not minor fluctuation
- Aligns with round numbers or previous support/resistance zones
Step 3: Connect At Least 2-3 Points
Draw your initial line connecting the swing points:
- Minimum: 2 points to establish the line
- Confirmation: 3rd touch validates the line’s importance
- Strong signal: 4+ touches indicate institutional participation
Step 4: Validate With Price Reactions
Observe how price behaves when it touches your line:
- Does price bounce strongly or just pass through?
- Are there reversal candlestick patterns at touch points?
- Is volume increasing at these reactions?
Step 5: Monitor and Adjust Continuously
Markets evolve – your trend lines should too:
- Update lines as new swing points form
- Remove lines that are no longer being respected
- Keep old lines visible (make them dotted) to track flipped support/resistance
4. Key Factors to Consider in Trend Lines Analysis
Trend lines analysis seems effortless on paper.
Drawing the lines will barely take a minute once experienced with the trading platform. Then, forecasting future moves should already be direct from the highlighted levels.
However, extensive practice in live trading conditions tells a different story.
Every interested trader must understand the several caveats that come with this strategy. Below are a few helpful tips:
4.1 Breakouts at Any Time
The primary purpose of trend lines is to anticipate levels the market price will likely respect (turn away from) with high accuracy. Any bullish move should halt and reverse at a downtrend line, and bearish ones should switch directions at the uptrend lines.
That said, breakouts can happen at any point. It signifies potential trend reversals, which can get anyone on the wrong side of the market.
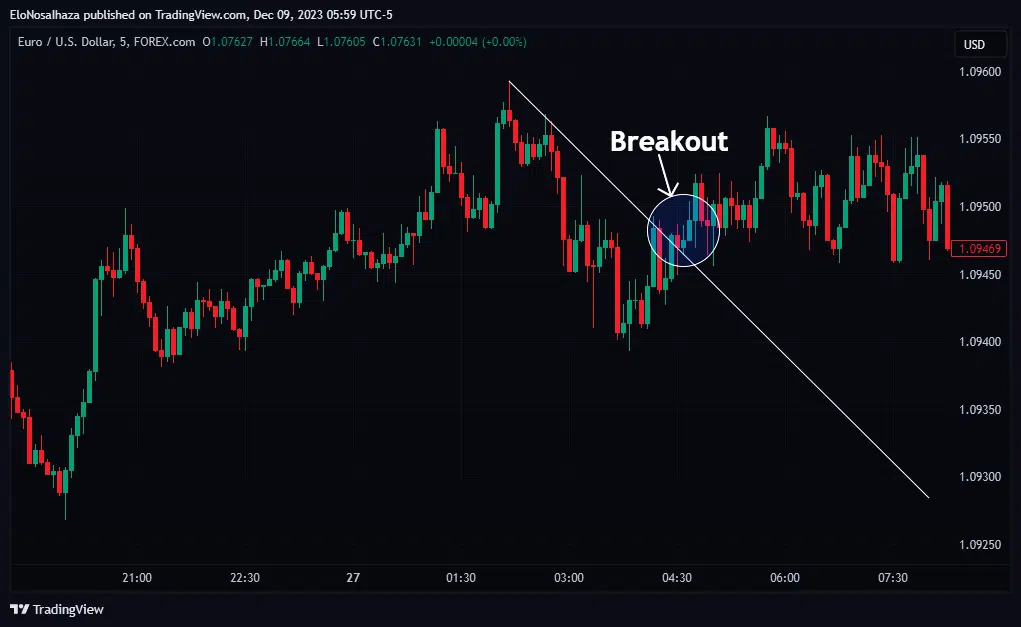
The pros always remember this during analysis and take essential risk management steps to avert worst-case scenarios.
How to Handle Breakouts:
- Always use stop-losses positioned beyond the recent swing structure (not just beyond the line)
- Watch for false breaks – price spikes through then quickly returns (these often lead to strong reversals)
- Confirm real breakouts with volume surge and full candle closes beyond the line
- Consider trading breakouts rather than fighting them – broken support becomes new resistance and vice versa
4.2 Better Application With Other Parameters
Assume a currency trader closely monitors the EURUSD price respecting an uptrend line in the London session of the month’s first Friday. It would be more shrewd to wait for the NFP release in the NY session before taking any day trading opportunity.
Such high-impact releases typically distort the prices of Forex majors in surprising ways.
Similarly, a purely technical analyst may insist on a Moving Average cross before taking a trading signal trend lines offer when prices hit them.
Combining trend lines analysis with one or more analytical methods raises the odds of being successful.
Example of Trend Lines + Moving Averages:
- Wait for price to touch trend line AND bounce off the 50 or 200 EMA simultaneously
- Double confirmation significantly improves accuracy
- Example: Price at uptrend line + above 200 EMA = strong buy zone
4.3 Tight Stop-Loss Levels
It’s common for trend lines analysts to place stop-loss orders just below or above trend lines in expectation of solid support or resistance.
However, prices aren’t always perfect and can just move beyond the levels before reversing. They could trigger one’s stop-loss order for what could have been a profitable opportunity.
Hence, giving trades more room to roam is most encouraged. Reduce the lot size or number of trades if you can’t bear the potential risk.
Better Stop-Loss Placement Methods: Structure-Based Stops
- Place stops beyond the most recent swing low/high (not just the line)
- Gives trades proper room to breathe
- Example: Line at 1.0850, last swing low at 1.0820, place stop at 1.0815
4.4 Short- and Long-Term Perspectives
Trends appear in every timeframe. Thus, traders can always have short- and long-term trend lines to work within.
A seemingly perplexing breakout in an M1 chart may be moving to respect an M5 trend line. Similarly, consolidations on an M15 chart may keep riding a trend line on lower timeframes.
Every trend lines analyst must understand this and implement multi-time studies for better results.
Multi-Timeframe Best Practices:
- Start with Higher Timeframe (Daily/H4): Identify the major trend direction
- Refine on Lower Timeframe (H1/M15): Find precise entry points
- Trade With Higher Timeframe: “The trend is your friend” remains true
- Set alerts on multiple timeframes: Get notified when price approaches key lines
4.5 Continuous Adjustment With New Price Data
During market hours, prices keep moving until a trading day’s end.
Any trend line drawn during the period needs continuous adjustment based on the new price data available. Therefore, traders must always stay active to make the most of this analysis.
The best-case scenario is that the price continues to respect the lines for as long as possible.
New Swing Point Forms
- Price creates a new higher low in an uptrend
- Action: Redraw connecting the most recent 2-3 swing lows
- Result: Steeper line reflecting current momentum acceleration
- Don’t: Obsessively redraw after every small move
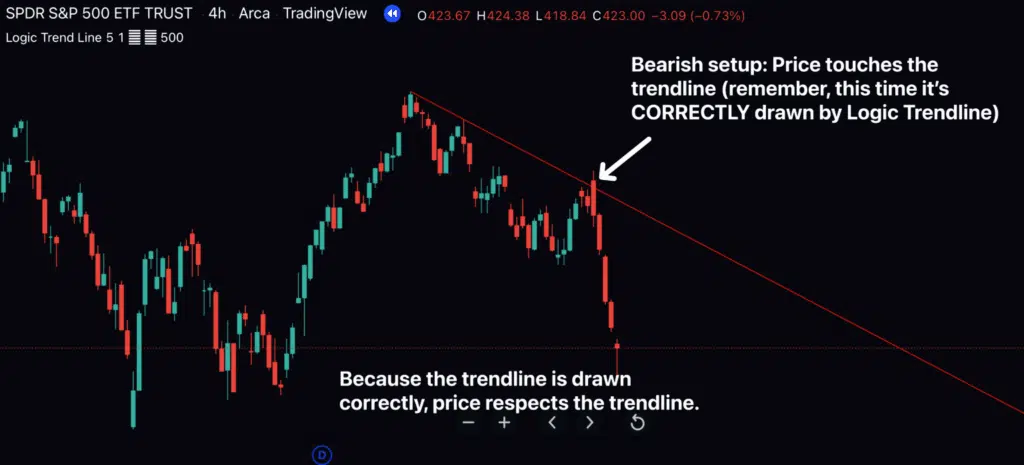
5. Raising the Bar With The Logic Trendline Indicator for TradingView
No matter how simple or daunting trendline analysis appears, veterans and newbies will always need assistance for the most profitable outcomes.
The most established choice is the Logic Trendline Indicator by Indicator Vault. It is a TradingView tool that reveals respectable trendlines in the charts for improved decision-making.
Once it draws the line, below are the benefits lucky users never miss:
- Understanding of the strongest support or resistance levels
- First-hand knowledge of potential breakouts and reversals
- Ability to trade in any preferred timeframe
- Quickest awareness of the next most favorable opportunity, thanks to the timely alerts
Best Used When:
- You already understand manual trend line principles (tools enhance, not replace knowledge)
- Scanning multiple charts quickly for opportunities
- Confirming your own manual analysis to reduce subjective bias
- Saving time while maintaining analytical rigor
6. Summary
Trendline analysis, one of the most common strategies in technical trading, entails using straight lines for price forecasts. Curious folks should learn that breakouts can always occur, and the lines work best with other parameters, among several conditions.
However, the Logic Trendline Indicator makes the process stress-free yet highly rewarding.
Feedback, from studies to results, is most welcome in the engaging Comment Section. Please also share this article with other aspiring traders to increase awareness of this technical approach.