


The Relative Strength Index (RSI) is one of the most widely used and trusted momentum indicators in technical analysis. While powerful, RSI often suffers from false signals, lag, and whipsaws that can frustrate traders. Learn how the RSI trading strategy works, what its biggest limitations are, and how the A-RSI indicator overcomes these challenges to deliver clearer, more profitable entries.
The Relative Strength Index (RSI) is a momentum oscillator developed by J. Welles Wilder Jr. in 1978. It measures the speed and change of price movements, oscillating between 0 and 100.
The primary function of the RSI is to determine if a security is overbought or oversold. It is calculated by taking the average gains of winning periods and comparing them to the average losses of losing periods over a specified lookback period (typically 14 periods).
In simple terms, RSI tells you this:
The two most common strategies derived from the Classic RSI are based on its extreme readings:
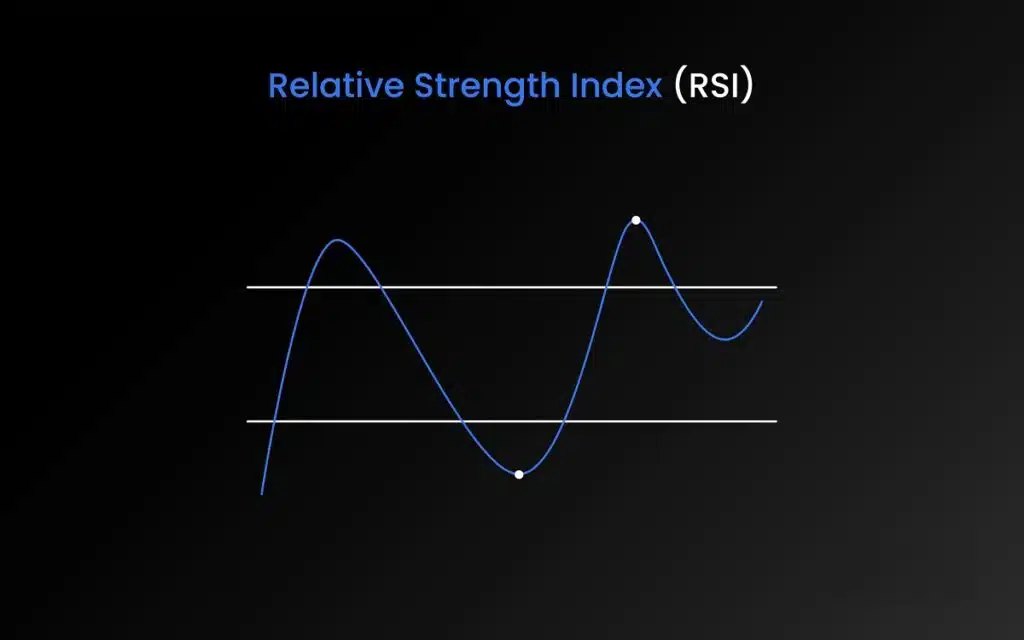
When the RSI moves above the 70 level, the asset is generally considered overbought. This suggests the buying momentum is becoming excessive and the price may be due for a pause or a reversal.
Trade Idea: Traders might look to initiate a short position or sell an existing long position when RSI crosses back below 70.
When the RSI drops below the 30 level, the asset is generally considered oversold. This suggests the selling momentum is becoming exhausted and the price may be due for a bounce or a reversal.
Trade Idea: Traders might look to initiate a long position or cover a short position when RSI crosses back above 30.
While the RSI is foundational, relying solely on its 30/70 thresholds can be dangerous, especially in strong trending markets. The limitations of the Classic RSI often cost traders money:
These limitations highlight the need for an indicator that retains the momentum strength of the RSI but adds smarter filtering and earlier detection.
The A-RSI (Advanced RSI) indicator for TradingView was engineered to solve the chronic problems of whipsaws and lagging signals inherent in the Classic RSI. By fusing the classic formula with a proprietary advanced algorithm, the A-RSI provides a significantly clearer and more sensitive read on true market momentum.
How A-RSI fixes the classic problems:
The A-RSI indicator is a versatile tool that works across all markets (Forex, stocks, commodities) and timeframes, adapting seamlessly to both trending and ranging conditions where the Classic RSI often fails
The Classic RSI remains a critical tool for gauging momentum, but its lag and susceptibility to false signals can severely limit trading success.
The A-RSI indicator eliminates these limitations, providing early, clean, and confirmed momentum signals. For traders who want to use the power of the RSI without falling into the “overbought/oversold trap,” the A-RSI offers a significant edge.
When you are ready to trade momentum with clarity and precision, explore the A-RSI indicator for TradingView.