Table of Contents
The biggest challenge in trading isn’t finding a strategy, it’s knowing when to use it. If you apply a trend-following system (like MACD or moving averages) when the market is chopping sideways, you lose money.
If you try to scalp reversals (using RSI or Bollinger Bands) during a strong breakout, you lose money.
The Market Mode Finder eliminates this guesswork by giving you a single, objective answer to the only question that matters: Is it the sideways market or trending market right now?
1. Understanding the Two Market Modes
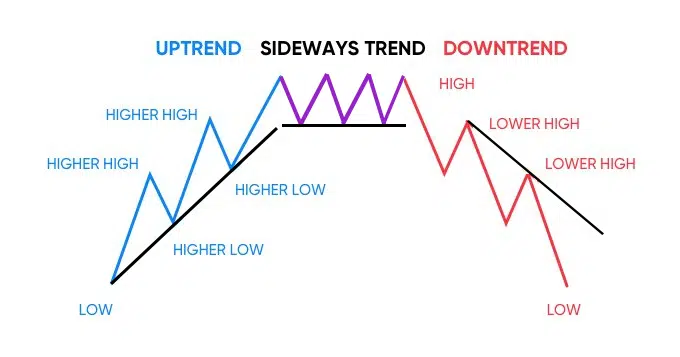
1.1 What is Trending and Sideways Market?
In trading, price action generally exists in one of two states:
- Trending (Momentum): The price is making steady movement in one clear direction (up or down). The focus here is on continuation and riding the wave.
- Sideways (Mean Reversion): The price is oscillating, or moving sideways, typically bouncing back and forth between defined support and resistance levels. The focus here is on reversal back toward the average.
1.2 Why does confusing them matter?
Most traders use different indicators for each mode. For example, you use moving average crossovers to find trends, and RSI extremes to find ranges. This often leads to conflicting signals and deep confusion.
The biggest mistake is applying the wrong strategy to the wrong mode.
- Using a Trend-Following strategy (like a simple breakout) in a sideways market leads to fakeouts and whipsaws.
- Using a Mean Reversion strategy (like shorting an overbought level) in a strong Trending Market leads to catching falling knives or selling into powerful momentum.
For traders, knowing the true market mode helps you enter a trade with the correct strategy instead of guessing and hoping.
2. Strategies for Trading with Mode Clarity
2.1 The Problem with Single-Strategy Trading
While a single indicator or strategy might be profitable for one specific market type, relying on it alone guarantees mistakes. This is because every standard indicator is fundamentally flawed in one of the two major market conditions:
- The RSI Trap (Range Indicator Failure): The Relative Strength Index (RSI) is excellent at spotting overbought/oversold levels in a sideways market. However, during a strong trend, the RSI can remain “stuck”above 70 (in an uptrend) or below 30 (in a downtrend) for days or weeks. If you trade this as a reversal signal, you will be stopped out immediately by the continuing trend.
- The MA Crossover Trap (Trend Indicator Failure): Simple Moving Average (MA) crossovers are great for signaling the start of a new trend. However, during sideways, choppy markets (a range), the MAs constantly weave back and forth, generating countless false buy and sell signals (whipsaws). This destroys trading capital quickly.
You waste time manually cross-checking your indicators, leading to hesitation, late entries, or missed moves completely.
That’s why you need an objective tool to command your strategy switch.
2.2 How the Market Mode Finder Simplifies Analysis
The Market Mode Finder indicator simplifies this by providing a complete, objective view.
It mathematically determines the current environment and tells you which set of rules to apply.
It brings the data together so you can use it for any trading style, including day trading, swing trading, and scalping, with far greater confidence
3. How the Market Mode Finder Delivers Clarity
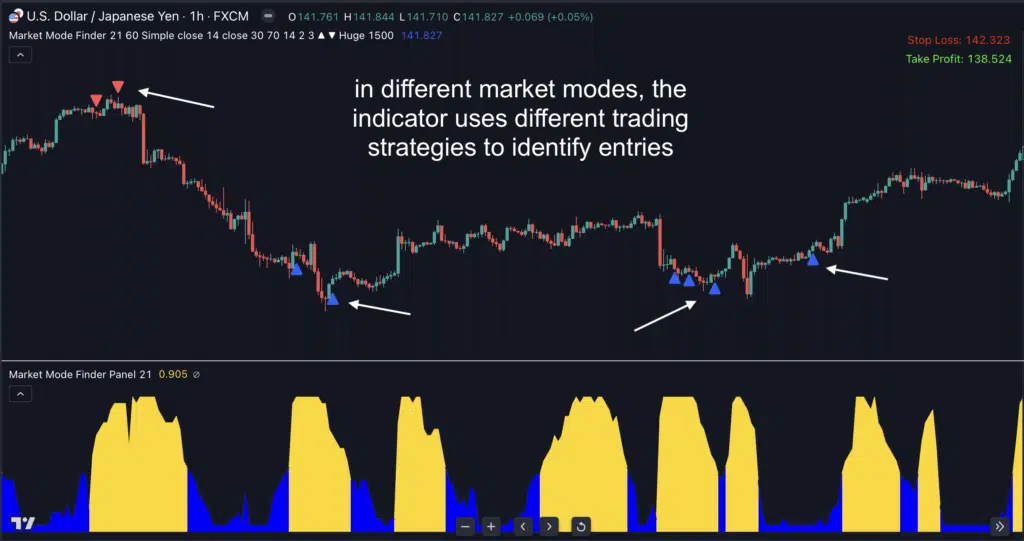
This is where the Market Mode Finder indicator changes the game. It integrates advanced volatility analysis into a single, clean view that immediately identifies the dominant market mode.
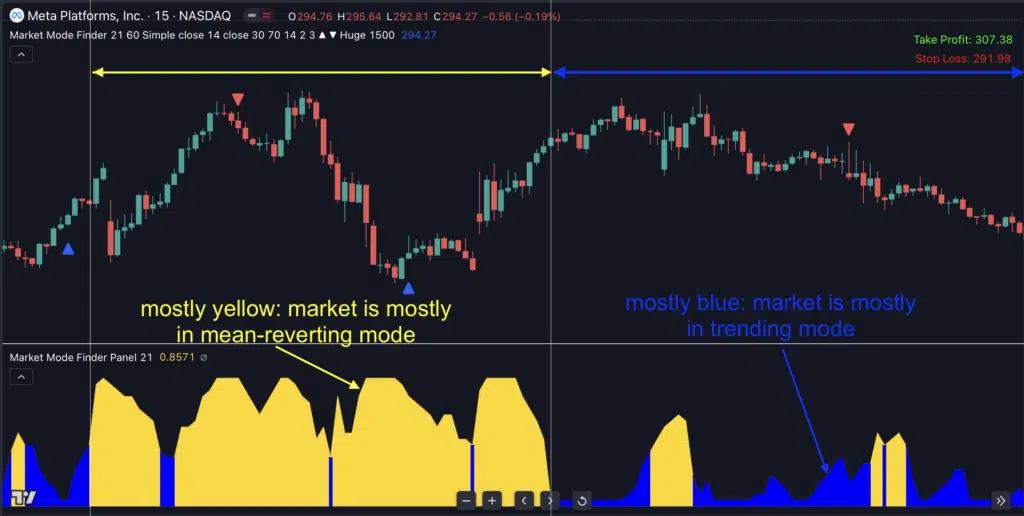
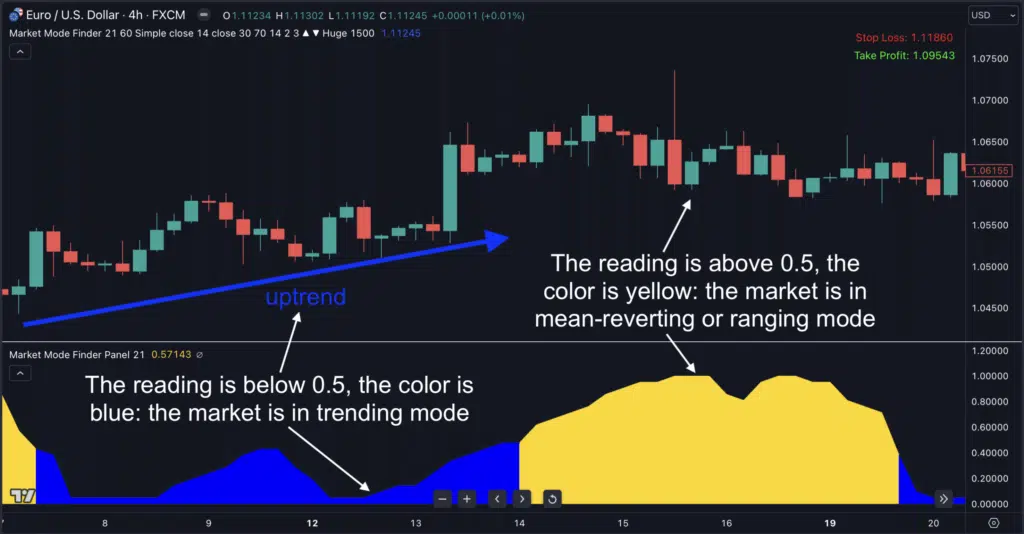
The indicator uses a simple color-coded traffic light system to command your strategy:
Step 1: Mathematical Mode Analysis The indicator evaluates market conditions based on price volatility and range expansion using proprietary algorithms. It sets a neutral threshold (0.5).
Step 2: Instant Strategy Command Based on its analysis, the indicator switches its display and its internal logic:
- 🟢 BLUE (Reading below 0.5): Trending Mode Active. The indicator uses its internal SMA logic to pinpoint ideal trend-following entries.
- 🟡 YELLOW (Reading above 0.5): Sideways Mode Active. The indicator uses its internal RSI logic to pinpoint ideal mean-reversion entries.
Step 3: Clear, Validated Signals The indicator only gives you a signal based on the appropriate logic for the current mode, effectively eliminating the false signals that come from trying to apply a trend rule in a range. You get an immediate answer: Is the market sideways or trending?
4. Who is the Market Mode Finder for?
- For Traders Seeking Consistency: If your profitability swings wildly because you constantly apply the wrong strategy, this tool forces discipline and consistency by objectively commanding your entries.
- For Day Traders and Scalpers: The indicator’s instant color-coded feedback is perfect for fast-moving markets. You can quickly identify strong momentum or potential reversal zones, allowing you to get in and out with confidence.
- For Swing Traders: By confirming shifts in the dominant market mode on larger timeframes, it gives you a clearer picture of when a major Trend is collapsing into a Range (or vice-versa), allowing you to prepare for the next large move.
For Any Strategy: Whether your goal is to trade breakouts, find reversals, or simply ride a trend, this tool provides a clear command that simplifies your analysis and helps you validate your decisions.
5. Make better trading decisions
With the Market Mode Finder, you are moving beyond the realm of guesswork and emotional reaction.
Your screen is no longer a source of anxiety filled with contradictory lines, but a clear command center.
Instead of constantly second-guessing whether momentum is real or if a reversal is a trap, you gain immediate, objective insight.
When the market shifts from chop to momentum, you won’t just wonder what’s going on: you’ll know whether to ride the BLUE trend or short the YELLOW range.
The Market Mode Finder is the tool that tells you exactly what to do.
Click here to see this indicator in action