Markets don’t reverse randomly. When price turns sharply or respects a level with precision, there is usually a structural reason behind it. One of the most effective frameworks for explaining these movements is the concept of the supply and demand trading zone.
In this article, we’ll explain what supply and demand trading zones are, how they differ from traditional support and resistance, and how the Supply Demand PRO indicator can help traders analyze these zones more systematically and consistently in real market conditions.
Table of Contents
1. From Support And Resistance To Supply And Demand Zones
Most traders are first introduced to support and resistance. These levels are based on historical price reactions and are often drawn as horizontal lines across a chart. While useful, support and resistance have a limitation: they show where price reacted, but not why it reacted.

Supply and demand trading zones aim to answer that “why”.
A demand zone forms when buyers step in aggressively, creating a strong upward move. A supply zone forms when sellers dominate, pushing price down rapidly. These zones highlight areas where order imbalance occurred, where buying or selling pressure clearly outweighed the opposite side. Because large market participants tend to place and defend positions in these areas, price often reacts again when it returns.
To understand why supply and demand trading zones offer more context, it’s important to define what actually qualifies as a zone.
2. What Is A Supply And Demand Trading Zone?
Rather than focusing on single price levels, supply and demand trading zones are built around price behavior. It usually includes:
- A short consolidation or “base”
- Followed by a strong impulsive move away
That impulsive move is what signals imbalance.
When price revisits the zone, traders monitor it for: Rejections, reversals, or continuation signals, depending on context.

This approach helps traders shift from reactive trading to anticipating where price is likely to respond.
3. Using the Supply Demand PRO Indicator For Zone Analysis
Understanding supply and demand trading zones in theory is straightforward. Applying them consistently in real market conditions is where most traders struggle.
Identifying zone strength, tracking how zones evolve, and filtering out low-quality levels requires structure and discipline. This is where tools like Supply Demand PRO are useful, not to replace analysis, but to support it by organizing supply and demand information clearly on the chart.
With that foundation in place, let’s look at the different types of supply and demand trading zones and how traders interpret their strength.

4. Understanding Types Of Supply And Demand Zones Based On Price Reaction
A supply and demand zone is not static. Its strength depends on how price behaves each time it is revisited. Every interaction provides new information about whether buyers or sellers are still active in that area.
Supply Demand PRO evaluates these interactions automatically by tracking price reactions, repeated tests, and zone breaks. Based on how price responds, zones are continuously reclassified to reflect their current reliability.
Below are the main types of supply and demand trading zones, grouped according to price reaction and repetition.
4.1 Weak and Untested Zones
When a supply or demand zone first forms, it starts as either weak or untested.
An untested zone is a newly formed area where price has not yet returned since the initial impulsive move. These zones are often closely watched because resting orders may still be present.
A weak zone may form when price reacts lightly or when the zone is located near market equilibrium. These zones can still produce reactions, but the commitment behind them is typically limited.
At this stage, the zone’s reliability is still uncertain.
4.2 Verified Zones
When price returns to a zone and reverses from it, the zone gains credibility. At that point:
- A weak or untested zone becomes verified
- The market confirms that buyers or sellers are still active in that area
If price reverses at the same zone more than once but fewer than four times, the zone remains classified as verified.
Verified zones suggest consistent participation and are often favored by traders who prefer confirmation before engaging.

4.3 Proven Zones
When price reacts at the same supply or demand zone four times or more, the zone becomes proven. Proven zones indicate:
- Repeated defense by market participants
- Strong institutional interest
- High visibility across timeframes
These zones often act as major structural levels and are commonly used for:
- High-confidence entries
- Take-profit targets
- Market bias decisions
4.4 Turncoat Zones
A zone does not remain valid indefinitely. If price breaks through a supply or demand zone, the status of that zone changes to turncoat. A turncoat zone represents a role reversal:
- Former demand becomes supply
- Former supply becomes demand
These zones are especially important because they often signal:
- Trend continuation
- Structural shifts
- Failed defenses by previous participants
Turncoat zones frequently act as powerful retest levels after a breakout.
5. Analyzing Supply And Demand Zones Across Multiple Timeframes
Beyond repeated reactions, Supply Demand PRO tracks zone behavior across multiple timeframes to better assess each zone’s reliability.
Knowing that supply and demand trading zones can exist on different timeframes is one thing. Being able to track, visualize, and align those zones automatically across charts is where Supply Demand PRO adds real value.
For example, a demand zone detected by Supply Demand PRO on the 1-hour chart remains visible and structurally consistent when switching to the 5-minute chart.

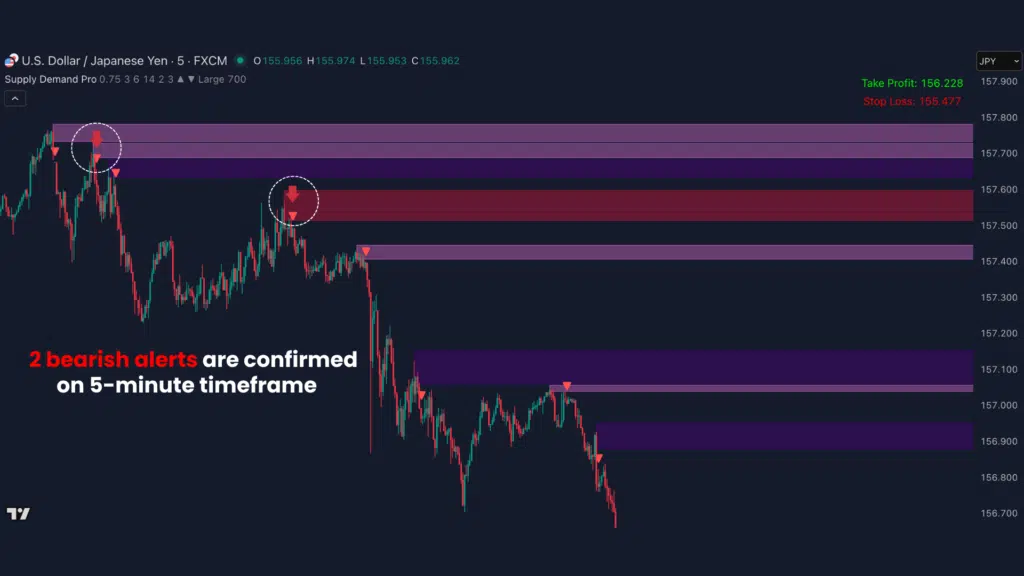

On the lower timeframe, the indicator often reveals smaller nested zones inside the higher-timeframe area, helping traders refine entries while staying aligned with the broader market context.
This allows traders to define direction on higher timeframes and execute with precision on lower ones, using the same zones, organized and maintained by the indicator.
6. Step-by-Step Video Guide: Supply Demand PRO In Action
To see how supply and demand trading zones behave in real market conditions, the step-by-step video guide walks through Supply Demand PRO in action.
The video shows how the indicator automatically identifies and updates supply and demand trading zones as price interacts with them, removing much of the guesswork that often leads traders to enter at weak or invalid levels.
It also demonstrates a multi-timeframe approach, where zones are defined on a higher timeframe and refined on a lower one, helping traders align structure with execution.
7. The Bottom Line
Supply and demand trading is conceptually simple, but consistency is difficult without structure.
Supply Demand PRO helps organize supply and demand trading zones based on how price reacts to them, making it easier to focus on meaningful levels and apply the concept across multiple timeframes.
For traders looking to trade with more clarity and discipline, Supply Demand PRO offers a practical way to apply supply and demand analysis in real trading conditions.