Support and resistance have been core concepts in technical analysis for decades. Although they are not visible until placed on the chart, these price zones guide market psychology, help identify potential reversals, and improve market forecasting.
This article focuses on the support level – how it forms, why traders rely on it, and the unwritten rules experienced analysts follow. You’ll also discover a powerful indicator that highlights the strongest levels automatically.
Table of Contents
1. Fundamentals of Support Level in Technical Analysis
1.1 What is a support level?
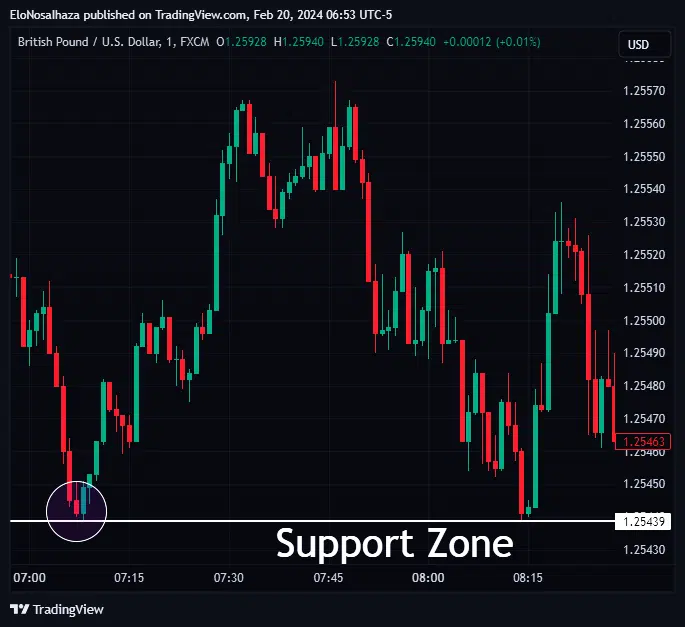
In technical analysis, a support level is a price area where the market historically prevents further decline. It acts like a floor, attracting buying pressure strong enough to slow or reverse a bearish move.
A reliable support level is one where price consistently reacts around previous lows, backed by strong buying interest and repeated successful retests. When bullish candlestick patterns appear at this zone, it further confirms the strength of the support.
1.2 Understanding the relationship with resistance
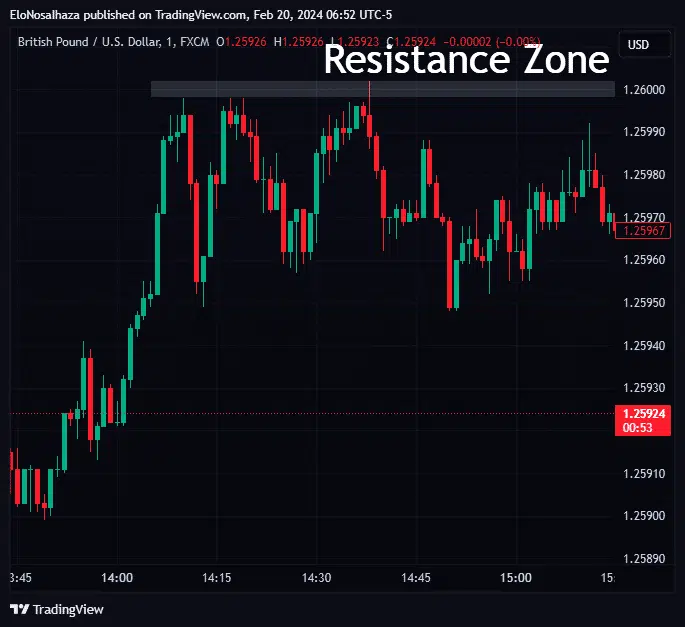
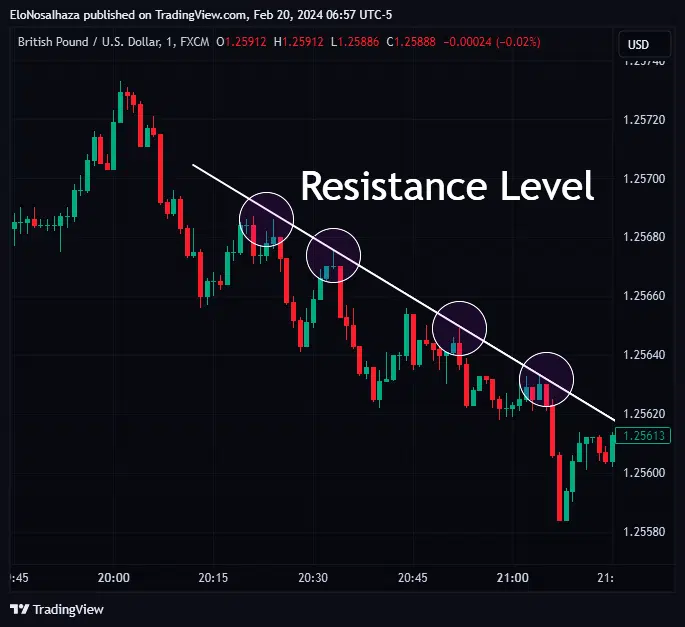
While a support level is the “floor,” the resistance level is the “ceiling” – a price area where selling pressure is expected to dominate, preventing prices from moving higher.
These two concepts are inseparable, as a price level that previously acted as strong resistance often becomes new support once the price successfully breaks above it. This phenomenon is known as role reversal.
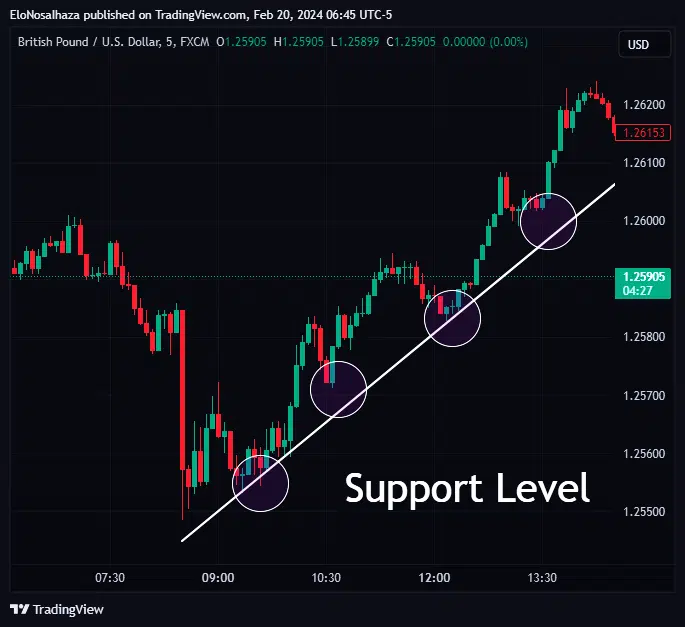
1.3 How to identify a strong support level
A strong support level is defined by the quality and frequency of its market reaction in the past. Look for:
- Historical turning points: Areas where price previously reversed after a sharp decline (old swing lows).
- Fibonacci confluence: Levels that align precisely with key Fibonacci retracement ratios (e.g., 61.8%).
- Psychological levels: Round numbers (like $50.00 or $100.00) where many market participants tend to place orders.
- High-volume areas: Price ranges where high trading volume occurred, indicating strong institutional interest.
1.4 Why support levels break an what to do about it
No support level is unbreakable. Levels often fail when a sudden, overwhelming shift in market sentiment (high-impact news or central bank decisions) creates massive selling pressure.
When a support level breaks, two things typically happen:
- Acceleration: Price often accelerates downwards as trapped buyers liquidate their positions (stop-loss orders get triggered).
- Role reversal: The broken support level often becomes the new resistance level.
When a break occurs, do not try to buy it back immediately. Instead observe if the old support holds as new resistance on the next minor pullback.
2. Do’s and Don’ts When Trading Support & Resistance
With expert application, the support and resistance theory is among the most dependable technical trading options. Pro analysts can confidently forecast high-probability reversals and ride prolonged trends till the last pip.
Luckily, newbies can also find remarkable success by sticking to these rules:
2.1 DO: Supplement the support level with confirmation tools
Never trade based on a support level alone. A simple touch of the line isn’t a signal. You must confirm the presence of buyers.
Use additional strategies like bullish candlestick reversal patterns (hammer, engulfing,…) or momentum indicators (RSI turning up from oversold conditions) to validate the reversal again.
2.2 DO: Conduct multi-time frame analysis
A seemingly broken support level on a 15-minute chart may just be a test of a much stronger support level on the 4-hour or daily chart. Always draw and reference these key barriers from multiple chart durations to confirm the overall market structure.
2.3 DON’T: Compromise on clear reversal signals
Support and resistance can be subjective to draw. Avoid forcing trades on complicated, ambiguous, or poorly defined levels. Focus only on explicit, clean levels that have a clear, documented history of market reaction.
2.4 DON’T: Be too rigid with your expectations
A support level is a zone, not a thin line. Price will often overshoot or undershoot slightly. Flexibility is critical.
- Always place stop-loss orders a reasonable distance below the support zone to protect your capital.
- Manage risk by calculating your position size based on the distance between your entry and your stop-loss.
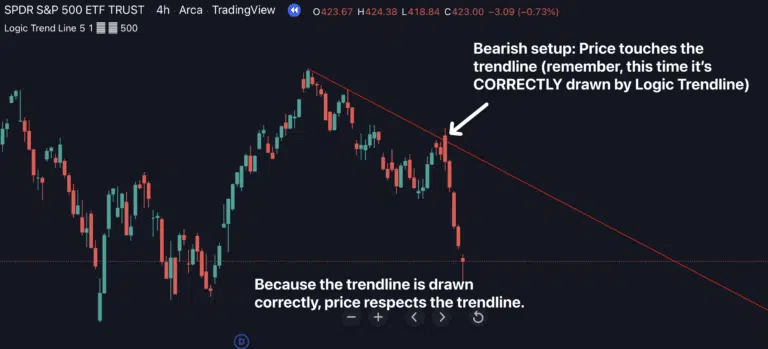
3. Trade the Support Level Like a Pro With the Logic Trendline Indicator
Attaining professional success with these principles is complex due to the subjectivity of drawing lines and the need to check multiple timeframes manually.
The Logic Trendline Indicator for TradingView removes the guesswork. It automatically identifies the most statistically significant and respected support and resistance zones, giving you a competitive edge.
Here’s how it helps you:
- Assurance of the best support or resistance zone in the market
- Earliest awareness of potential reversal points
- Liberty to engage any instrument or timeframe desired
- Guarantee of taking part in every potential opportunity, credit to the timely signal alerts
By using this indicator, you confidently conquer complex patterns and enter highly precise reversals across any market without ever drawing a line yourself.
4. Conclusion
Support level ensures an instrument’s price remains above, while resistance keeps them below. Hence, traders expect significant reversals in such areas.
New and interested analysts must learn to supplement this trading strategy with others while avoiding rigid expectations. However, with The Logic Trendline Indicator for TradingView, one can skip all the rules and boast better results.