Is volume the secret to a successful breakout trading strategy? Learn why analysts rely on volume data to confirm real moves and avoid costly fakeouts.
Table of Contents
1. Introduction
Most breakouts fail. The difference between profitable trades and losses often comes down to one overlooked metric: trading volume and breakout.
While price charts show where the market is going, breakout reveals the strength behind each move. When combined with a breakout trading strategy, this metric transforms from a simple counter into a powerful confirmation tool that helps traders distinguish genuine opportunities from false signals.
This guide explores how experienced traders use volume analysis to validate a breakout trading strategy and avoid common traps. You’ll learn a practical framework for identifying high-probability setups and discover a specialized tool designed to streamline the process.
2. Understanding Volume in Breakout Trading Strategy
Trading volume measures market activity – the total number of shares, contracts, or assets exchanged during a specific timeframe. If 200 stocks are bought and 200 sold within a minute, that minute’s volume registers as 400.
The absolute number matters less than its context. Traders compare current activity levels against historical patterns to gauge market conviction.
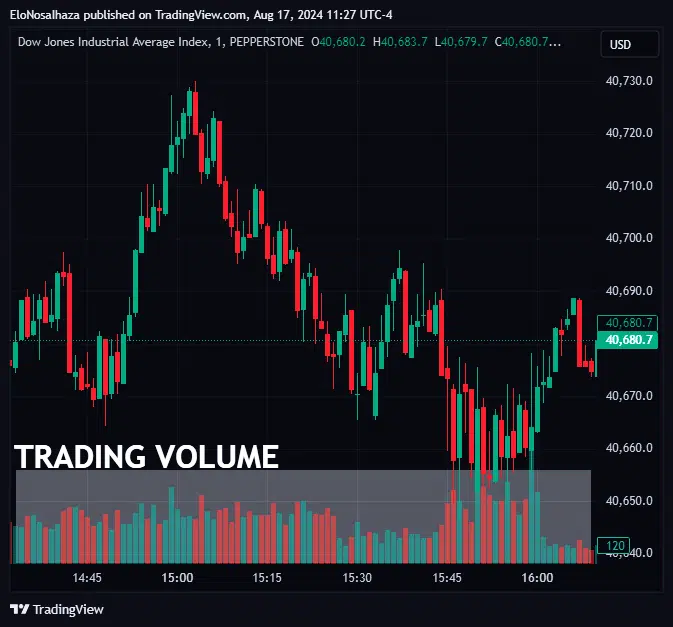
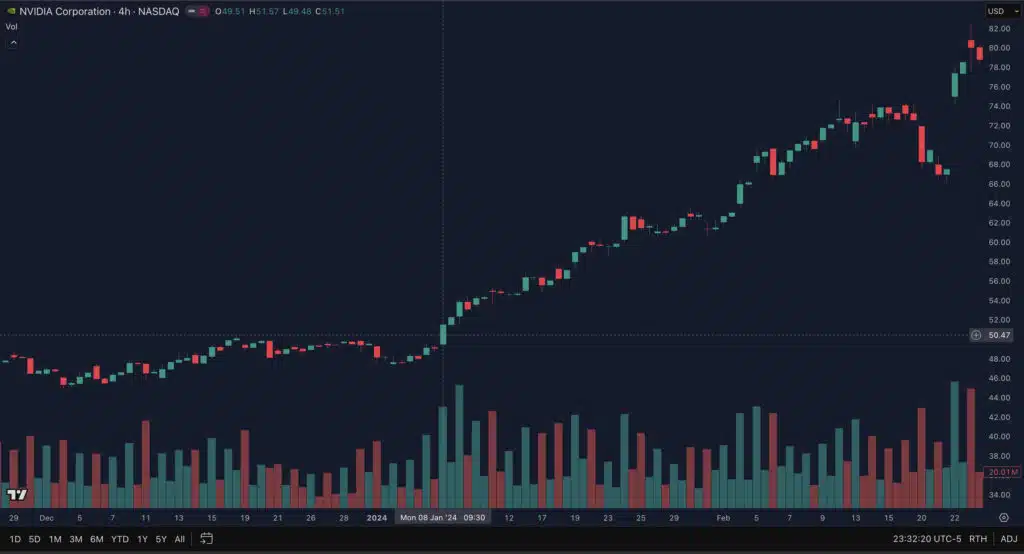
Most platforms display this data as bars beneath price charts, making it simple to spot activity spikes:
Why Volume Matters for a Breakout Trading Strategy
Higher activity levels typically accompany stronger price movements due to increased participant engagement. This correlation is the backbone of any successful breakout trading strategy.
Low participation often precedes reversals and false breakouts because fewer traders commit to the move.
However, interpretation depends on individual strategy and market context. What constitutes “sufficient” activity varies based on instrument type, timeframe, and overall objectives.
3. The High-Volume Breakout Trading Strategy Framework
Successful breakout trading requires more than identifying price levels – it demands confirmation that enough traders agree with the move. This framework combines technical levels with activity analysis to filter high-probability setups.
3.1 Three Breakout Classifications
Understanding how trading volume interacts with price action reveals three distinct types within a breakout trading strategy:
False Breakouts
Price moves beyond key levels but activity remains minimal. Without participant conviction, the market typically consolidates or reverses, trapping early entries. These are the most common and costly mistakes traders make.

Continuation Breakouts
These offer the highest probability setups. Price breaks through critical levels accompanied by surging activity, whether bullish or bearish. Strong participation confirms momentum and reduces reversal risk. This is where the strategy shines.
Reversal Breakouts
Activity spikes as price breaks against the prevailing trend. These require more caution than continuations since they involve counter-trend positioning, but elevated participation distinguishes them from false signals.
3.2 Step-by-Step Trading Process
Here’s a streamlined approach to trading continuation breakouts:
Step 1: Identify Key Levels
Mark significant support/resistance zones – swing points, previous consolidation areas, or other technical levels where price has historically reacted. These become your trigger zones.

Step 2: Confirm the Breakout
Watch for price to breach these levels while trading volume increase noticeably. Without this surge in participation, treat the move as suspect. Compare current bars to the previous 10-20 periods for context.
Step 3: Enter the Trade
Use your preferred entry method. Pullback traders might wait for retracements to the broken level; aggressive traders may enter on the initial break. Some wait for the next candle to confirm direction.
Step 4: Manage Risk
Place stops beyond the breakout candle. Monitor activity throughout the position – declining participation may signal weakening momentum. Consider scaling out as bars shrink.
4. Common Trading Volume Patterns That Signal Opportunity
Beyond single-bar analysis, recognizing multi-bar patterns helps anticipate a breakout trading strategy setup before it occurs.
The Volume Surge Pattern
Activity gradually increases as price approaches a key level, then explodes on the breakout. This pattern shows accumulation building before the decisive move. Look for:
- Bars growing progressively larger over 3-5 periods
- Breakout bar exceeds the average of previous bars by 50-100%
- Price closes near the high (bullish) or low (bearish) of the breakout candle
Enter on the breakout or first pullback. The building participation suggests institutional involvement.
The Climax Pattern
Massive activity spike followed by sharp price movement, then rapid decline in both. This often marks exhaustion points or significant reversals. Check for:
- Single bar 2-3x larger than recent average
- Wide-range candle with strong directional close
- Subsequent bars show diminishing activity
Fade the move or wait for consolidation. Climactic volume often precedes consolidation or reversal phases.
The Breakout-Retest Pattern
Price breaks on strong activity, pulls back on lighter trading volume, then resumes the trend when participation returns. Search for:
- Initial breakout with elevated bars
- Retracement to broken level with shrinking bars
- Resumption move with expanding bars (though typically smaller than initial breakout)
Enter on the retest when bars begin expanding again. This offers better risk/reward than chasing the initial break.
The Divergence Warning
Price makes new highs/lows while activity steadily declines. This warns that fewer participants support the trend. Seek out:
- Higher price highs with lower volume peaks (bearish)
- Lower price lows with lower volume troughs (bullish)
- Pattern developing over 5+ bars
Avoid breakouts in the divergence direction. Consider counter-trend setups if other signals align.
5. Enhanced Detection With Volume Breaker
Distinguishing false breakouts in real-time presents challenges even for experienced traders. Timing issues and subjective level selection often lead to confusion.
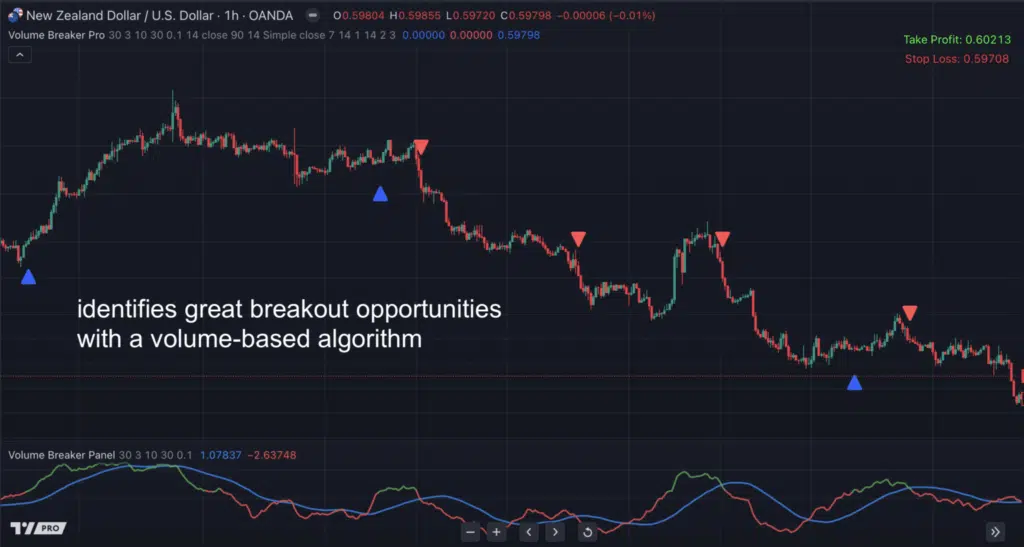
The Volume Breaker for TradingView addresses this problem through an algorithm that calculates the trading volume threshold required to validate a breakout trading strategy.
It combines price action with Average True Range measurements to determine when activity levels confirm genuine momentum.
Key Benefits:
- Real-time classification of genuine versus false breakouts for your breakout trading strategy.
- Identification of optimal exit zones
- Multi-instrument compatibility across markets
- Customizable alert system for opportunity notification
The tool provides objective confirmation where subjective analysis may fall short.
6. Conclusion
Volume analysis transforms a breakout trading strategy from guesswork into a systematic approach. By requiring elevated participation to validate price moves, traders filter out low-probability setups and focus on opportunities with genuine momentum.
The patterns outlined above work across timeframes, but mastering them takes practice. For traders struggling with false signals, specialized tools offer the breakout trading strategy confirmation needed to complement manual analysis.
For traders struggling with false signals, specialized tools like Volume Breaker offer trading volume confirmation that complements manual analysis.