Pro traders use various means, like split screens or several monitors to study multiple time frames. What exactly does this mean? Discover here today.
Table of Contents
1. Introduction
One recurring practice of pro traders during live sessions is navigating across multiple time frames of a financial asset. Established traders use various monitors with these chart periods; some divide one screen into the desired number, and others manually switch between the charts every other minute for studies. What exactly does this signify?
Delve into this article for the essence of multi-timeframe analysis, including its significance and how to pull it off successfully. Readers will also discover an ultra-modern technical tool that propels every trading strategy stress-free.
2. Understanding Time Frames and Its Significance
Strictly speaking, time frames are the intervals at which price data is displayed on trading charts. Young and old traders frequently toss the term in almost every circle because it defines how one views the market at any point.
Despite being a fundamental feature in most platforms, time frames heavily influence traders’ decisions in trend analysis. Longer time frames give insights into the primary market trend, while shorter ones are best for pinpoint trade entries and exits.
Moreover, time frame selections determine the type of trader one becomes. Scalpers and day traders typically focus on shorter-term options, unlike position traders who hunt opportunities on long-term charts.
Accordingly, below is a classification of time frames:
- Short-term Time Frames
- Intermediate-term Time Frames
- Long-term Time Frames
Short-Term Time Frames
These include the 1-minute (M1), 5-minute (M5), and 15-minute (M15) charts with relatively fast market moves. Some experts consider 30-minute (M30) and 1-hour (H1) charts short-term, depending on their usage.
Short-term time frames are popular among day traders and scalpers looking to exploit short-term market moves. They open and close positions within minutes or a few hours, but no one remains active beyond the trading day.
In combinations, swing and position traders can use them for precise trade entries and exits.
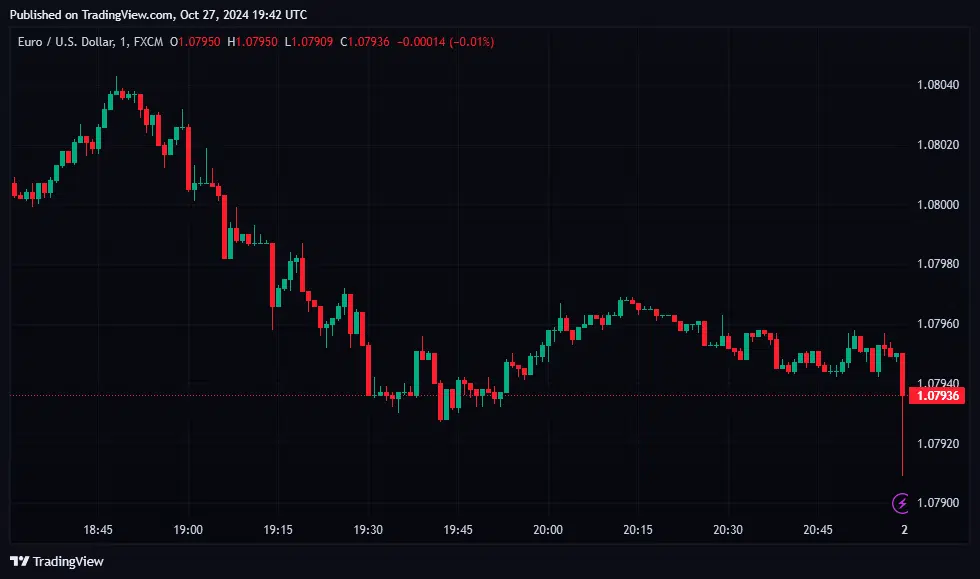
Below is an example of a 1-minute EUR/USD chart:
Intermediate-Term Time Frames
Intermediate-term (or medium-term) time frames are typically the 4-Hour (H4) and Daily (D1) charts. These time frames feature slow price data updates compared to the short-term options but are significantly faster than the long-term charts.
Traders who hold positions for weeks to months observe medium-term time frames the most.
When studying multiple time frames, H4 and D1 charts are helpful for re-confirming a long-term trend suggested by longer-term time frames.
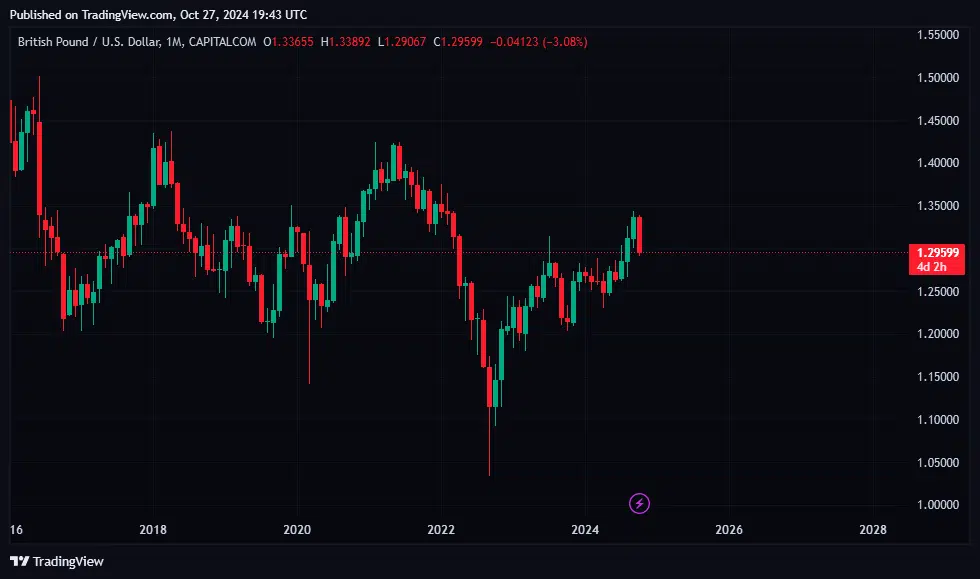
Long-Term Time Frames
True to their name, these charts display price data in the longest intervals.
Candles on weekly (W1) and monthly (MN) candlestick charts represent weeks and months, respectively.
These charts are familiar among position traders and long-term investors, who can leave a position active for years.
These charts are common among position traders and long-term investors, who can leave a position active for years.
Also, long-term time frames are the chief determinants of the contemporary long-term trend.
Hence, every desire to trade with the trend starts with studying these charts for optimum results.
3. How to Use Multiple Time Frames to Achieve Trading Success
Switching across time frames may seem unnecessary to the uninitiated, especially when done manually in quick succession. It is possible to perform all analyses and forecasts on one chart.
However, several independent studies prove that working with multiple time frames is far more effective.
Below is a general step-by-step approach to this practice:
Step 1: Trend Identification
Multi-time frame analysis begins with trend identification to determine the type and strength of the long-term primary move revealed by higher time frames.
For example, a day trader who works with a 15-minute (M15) time frame can use a 4-hour chart (H4) to confirm the long-term trend. Similarly, monthly charts guide position traders who primarily focus on weekly outcomes.
Various tools like the Moving Average can help with this confirmation on longer-term time frames.
Step 2: Re-Confirm the Trend
Next, re-confirm the trend by moving to a lower time frame than the primary one used for the trend identification.
In the earlier case scenario, the day trader can verify the trend with the Simple Moving Averages (SMAs) on H1 and M15 charts. A cross-over in the direction already revealed in the longer-term time frame is sufficient re-confirmation.
Step 3: Take Precise Entries & Exits
Precise trade entries and exits on lower time frames follow trend confirmations, and traders can use multiple tools, individually or combined, for this.
The magnified view ensures traders open and close positions favorably at the best time to ride the profit from the trend.
4. All Markets, All Time Frames: Your Command Center for Market Mastery
The no. 1 use of time frames for veteran traders is to approach the market holistically and align trades with the current trending conditions.
A mind-blowing invention, the 3MA Dashboard for TradingView, assures this with minimal effort.
The technical tool’s primary function is to scan 7+ markets and time frames for high-probability opportunities.
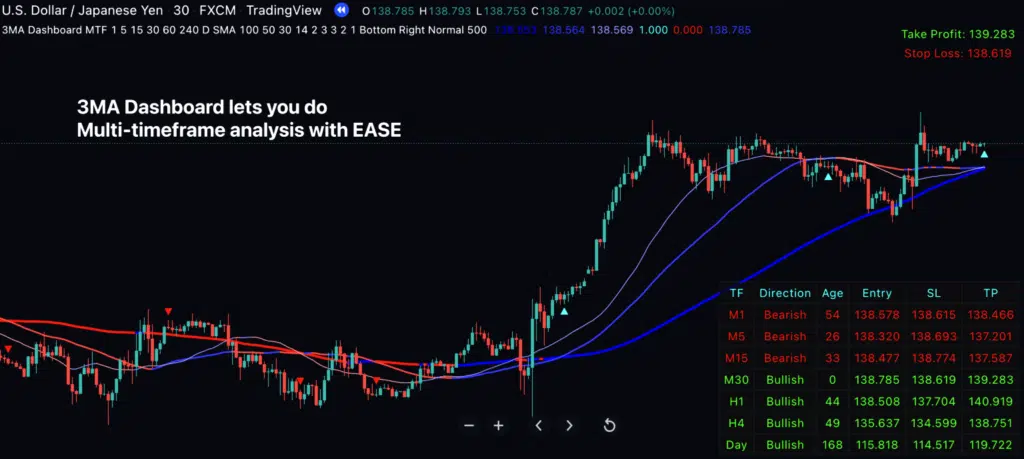
Concisely, here are the benefits every user obtains from its application:
- Improved awareness of the market conditions in one glance
- Ability to trade in any desired time frame or market
- Liberty to customize the tool in multiple ways
- Confidence in taking every opportunity due to the platform’s reliable alert system
Hard to believe? Discover these and many more perks to elevate your trading experience here now!
5. Conclusion
Nowadays, trading with multiple time frames is almost a prerequisite for success. Every expert does this in one way or another.
It typically involves identifying the long-term trend with higher time frames and improving trade entry & exit precisions with lower ones.
Newbies or intermediate-level traders can skyrocket their experience in this with the 3MA Dashboard for TradingView.
Please share this article with trading enthusiasts for increased awareness of analysis with multiple time frames and its benefits.
Also, leave a question or contribution in the engaging Comment Section below.