Table of Contents
1. What Is A Candlestick Pattern?
A candlestick pattern is a visual representation of price movements over a specific period, helping traders understand market sentiment. Each candlestick contains four key pieces of information: open, close, high, and low prices within a given timeframe.
Traders use these patterns to predict future price movements, spot potential reversals, and confirm breakout trends.
1.1 How many type of candlestick patterns are there?
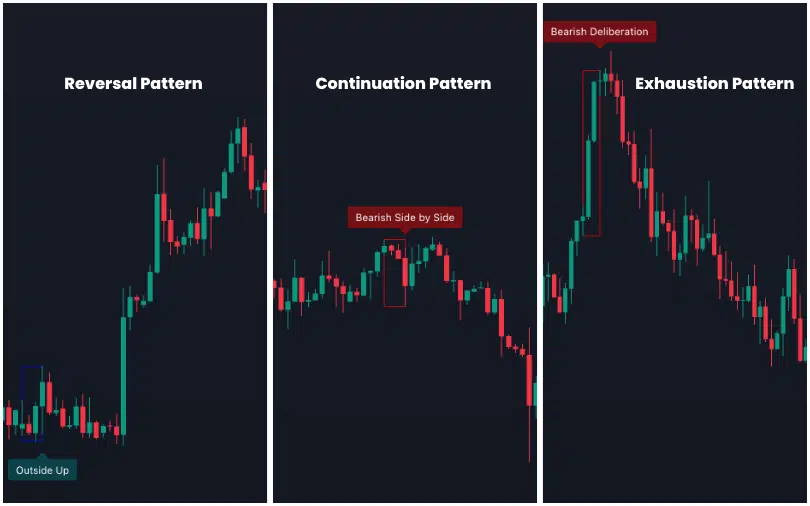
There are three main types of candlestick patterns:
- Reversal patterns – Indicate a potential change in trend direction (e.g., Doji, Outside, Hammer, Hanging man).
- Continuation patterns – Suggest that the current trend is likely to continue (e.g., Rising Three, Side by side, Marubuzo).
- Exhaustion patterns – Show weakening momentum, signaling a possible trend slowdown or reversal (e.g., Deliberation and Advance Block, Descent Block).
1.2 Why These Patterns Are the Key Market Timing Tool?
Ask any professional trader, and they’ll tell you: candlestick patterns are one of the most powerful tools for market timing.
Why? Because candlestick formations reflect real-time market psychology—showing the battle between buyers and sellers. By analyzing price action at key levels, they expose hidden shifts in momentum, trend reversals, and breakout confirmations before most indicators even react.
But here’s the problem:
- Manually analyzing these patterns is overwhelming. You have to memorize dozens of formations, scan multiple charts, and constantly validate signals.
- You might miss crucial signals. The market moves fast, and if you’re not spotting patterns in real time, you’re leaving money on the table.
That’s exactly why we developed the Candlestick Pattern Pro indicator…
2. How the Candlestick Pattern Pro Indicator Gives You an Unfair Advantage
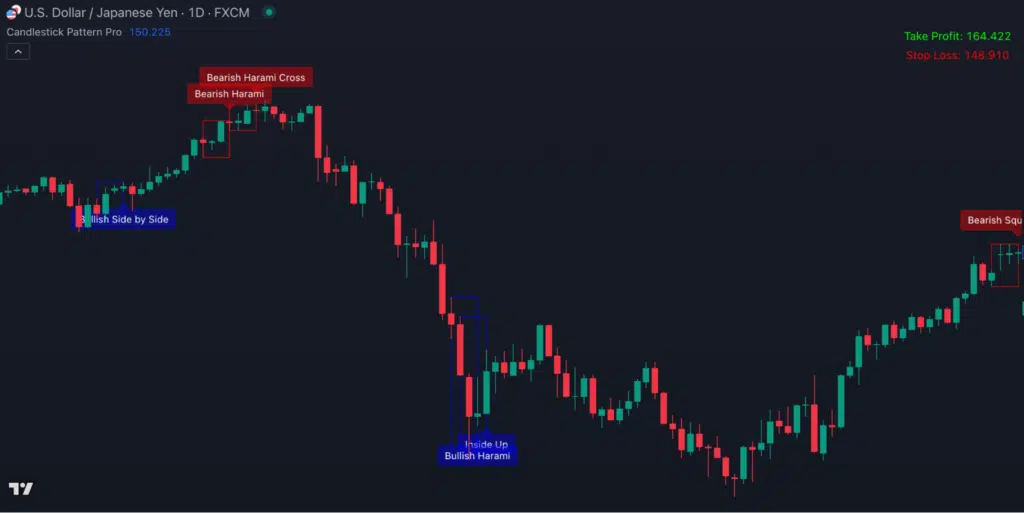
The Candlestick Pattern PRO indicator uses an advanced algorithm to accurately and quickly identify over 30 candlestick patterns on your chart.
Here are details what this amazing indicator can do for you:
- Spot over 30 candlestick patterns instantly
Forget about memorizing complex formations – this indicator automatically detects and labels reversal, continuation, and exhaustion patterns on your chart.
- Get clear buy and sell signals
Each detected pattern includes a visual confirmation, so you instantly know whether it’s a bullish or bearish setup.
- Trade with pre-calculated stop loss & take profit levels
The indicator doesn’t just show you the pattern – it also provides precise stop-loss and take-profit levels, so you can enter and manage trades like a pro.
- Customize it to fit your strategy
Want to focus on specific patterns? No problem. You can choose exactly which formations to track and filter out the noise.
- Works on any market & any timeframe
Whether you’re trading stocks, forex, crypto, or indices, this indicator adapts to any market and timeframe – from scalping to swing trading.
3. The Real Example with using the Candlestick Pattern PRO
Let’s say you’re watching EUR/USD on the 1-hour chart.
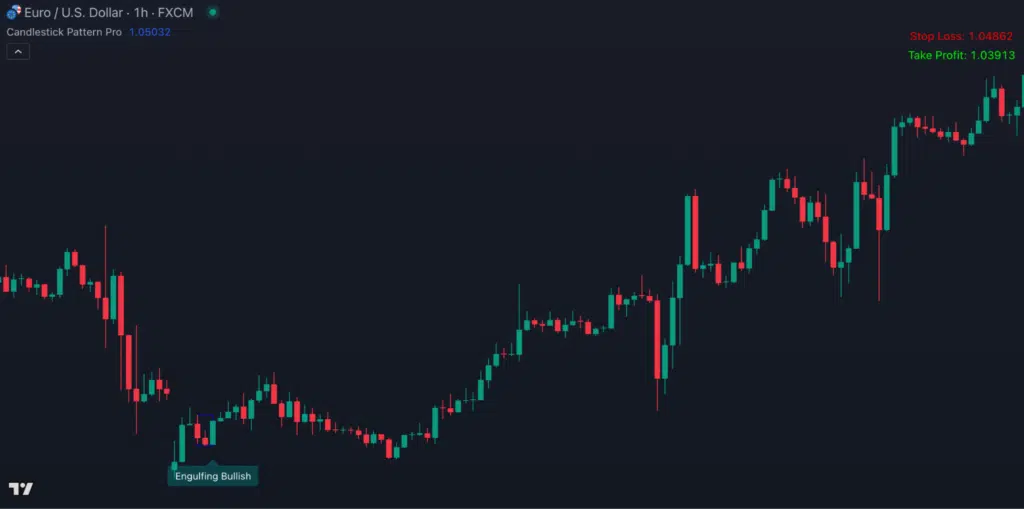
- This indicator detects a Bullish Engulfing pattern at a key resistance level-signaling a strong reversal.
- The indicator automatically plots a buy signal, along with a suggested stop loss and take profit level.
- Shortly after, the price rises precisely as predicted, hitting your profit target with ease.
4. Your Next Step: Take Control of Your Trades
Trading success comes from spotting the right opportunities at the right time—and that’s exactly what the Candlestick Pattern Pro Indicator helps you do. By automatically detecting over 30 powerful complex patterns, it gives you instant, high-accuracy trade signals, so you’re never left guessing.
Get the Candlestick Pattern Pro Indicator today and trade with confidence.