Table of Contents
1. What is a whipsaw in trading?
A whipsaw happens when price moves in one direction, only to quickly reverse and head the other way. It’s like taking a step forward, only to get pulled two steps back. It’s one of the most frustrating and expensive patterns traders face, especially in choppy or sideways markets.
What causes these whipsaws?
Typically, they’re caused by a combination of market noise, low liquidity, or unclear trend signals. The price briefly breaks through key support or resistance levels, luring traders into thinking a trend is forming – only for it to immediately reverse. For scalpers, swing traders, or anyone trying to catch a trend, this can feel like you’re chasing ghosts.
Why are whipsaws so dangerous?
The problem isn’t just the loss of money, it’s the mental toll:
- You start second-guessing every setup
- You hesitate on the next breakout, only to miss the real one
- You feel like the market is “out to get you”
The real issue is this: You need something better to consistently avoid whipsaws… to say goodbye to false breakouts and emotional rollercoasters…
2. The right indicator to beat whipsaws for good
Most common indicators like Simple Moving Averages (SMAs) and Bollinger Bands are prone to whipsaws. Here’s why:
- SMAs are lagging, reacting too slowly to price moves, which often leads to entering trades too late.
- Bollinger Bands, based on an SMA with standard deviation, don’t provide clear signals and can extend too far beyond price, creating false breakouts.
So what indicator really can help you?
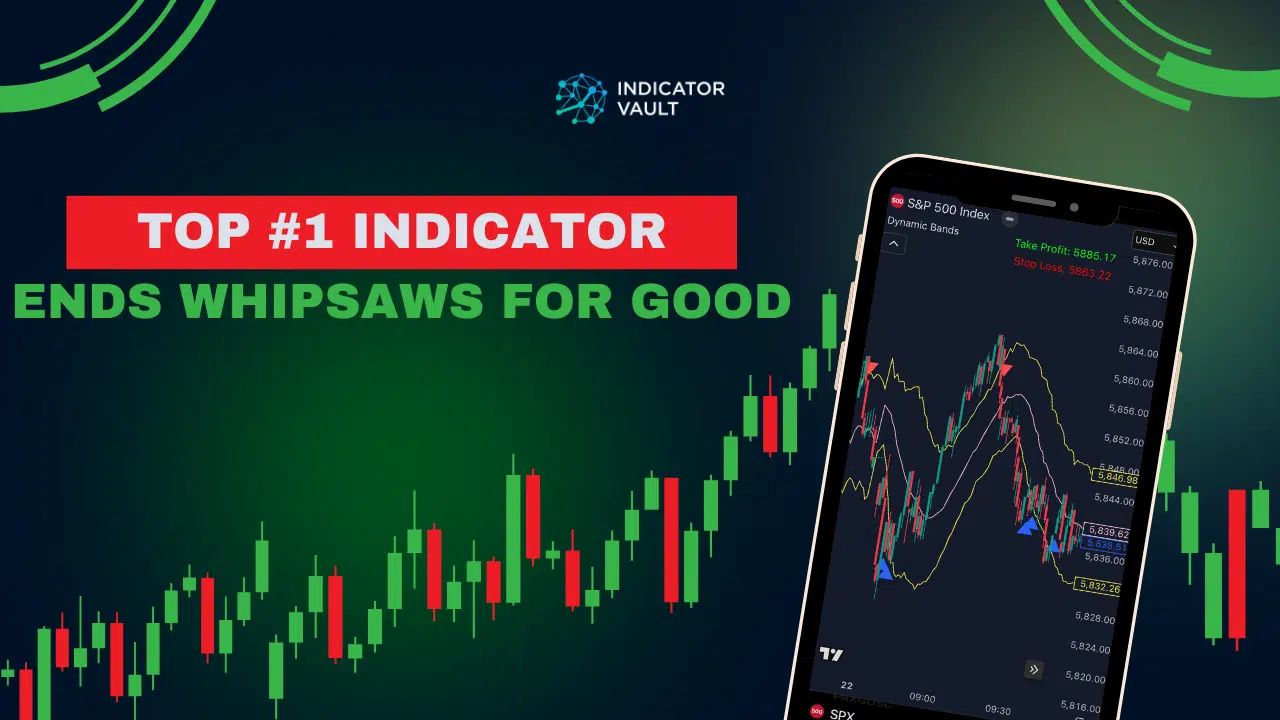
Introducing the Dynamic Bands indicator for TradingView – a powerful, whipsaw-resistant tool that’s been fine-tuned to ignore market noise and only alert you to valid trend signals.
By using a combination of our proprietary Dynamic Moving Average and Average True Range (ATR), here’s what it delivers:
- Shows you where the market is actually going, giving you clear, actionable trade signals based on real-time price action.
- Filters out fakeouts, and weak breakouts
- Suggests visual entry, stop loss, and take profit levels on your chart
- Works well across any market and any timeframe
3. How does the Dynamic Bands indicator work?
Unlike traditional tools, Dynamic Bands doesn’t rely on laggy SMA or risky statistical deviation. Instead, it creates a custom central line (Dynamic MA) and then builds upper and lower bands using multiples of ATR.
Here’s how this indicator works:
Step 1: Price moves outside the band → potential signal
Step 2: Wait for price to return inside the band → confirmation of real breakout
Step 3: Entry is triggered + SL/TP shown on chart
Step 4: Ride the valid trend, skip the fakeouts
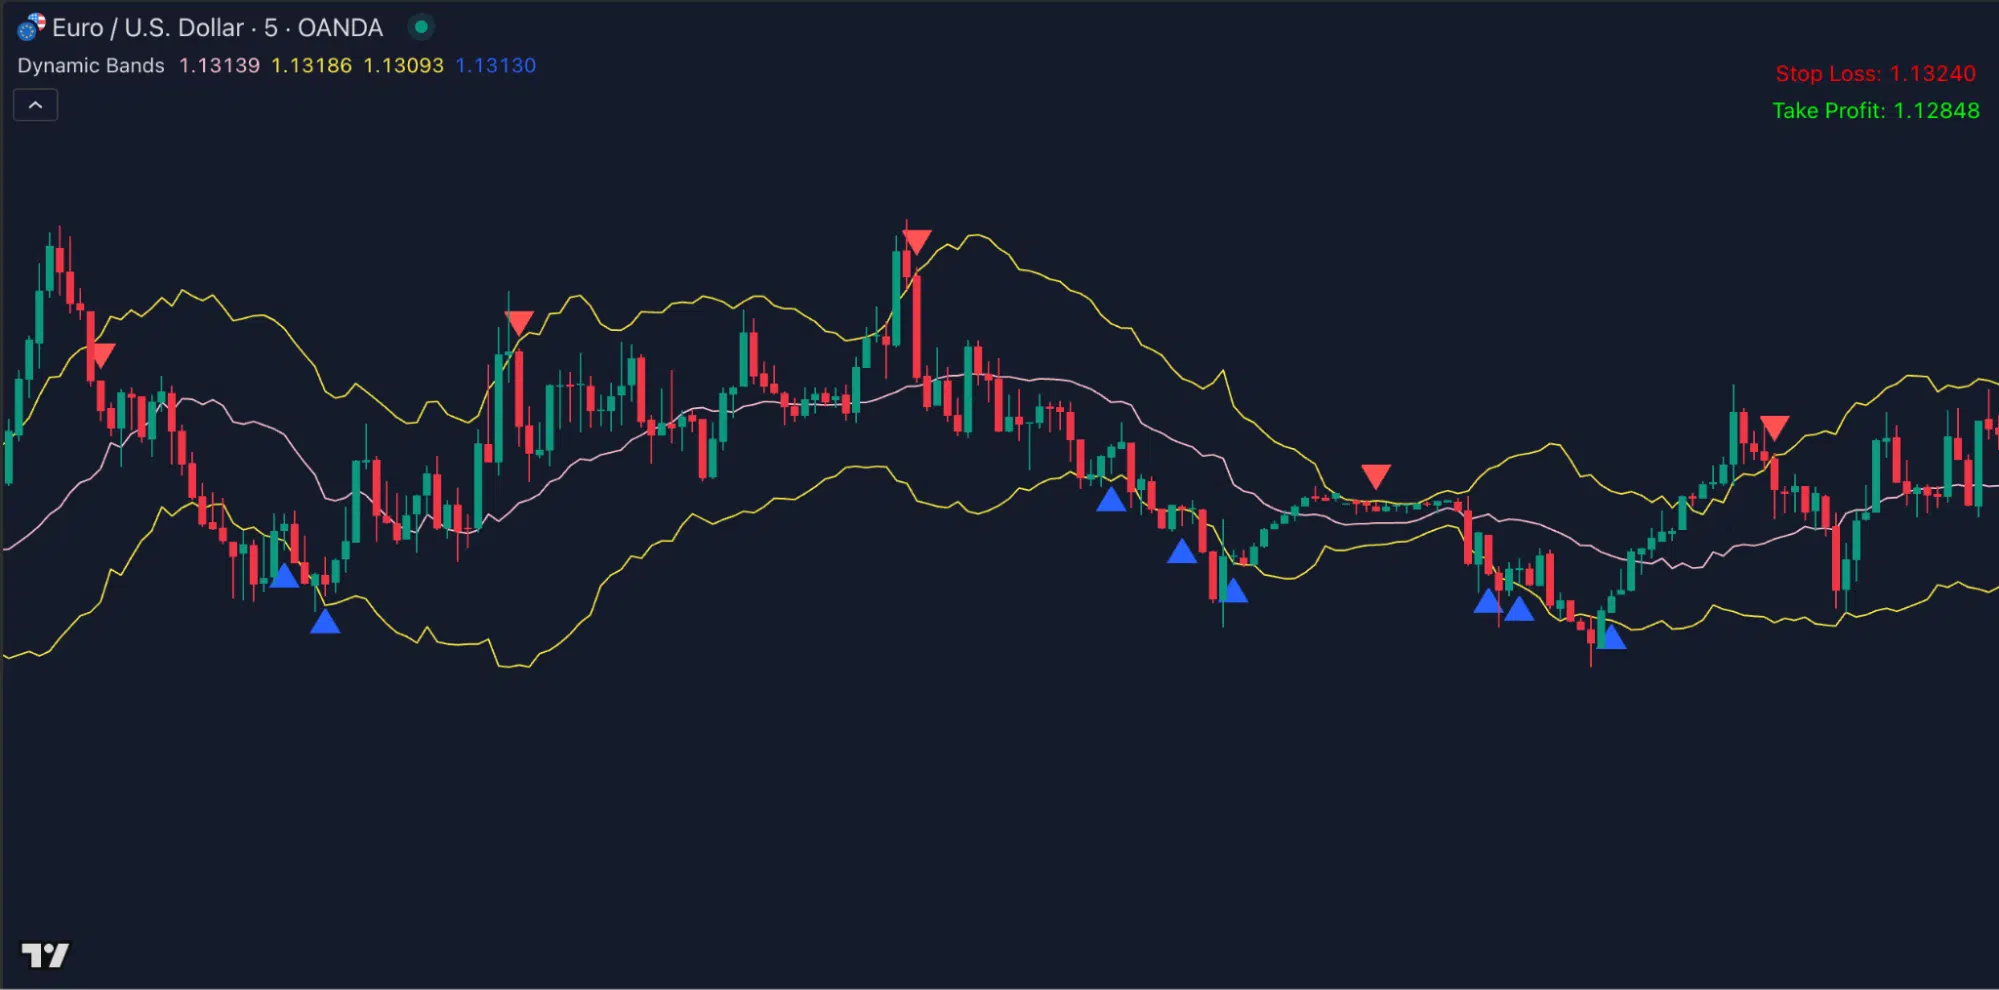
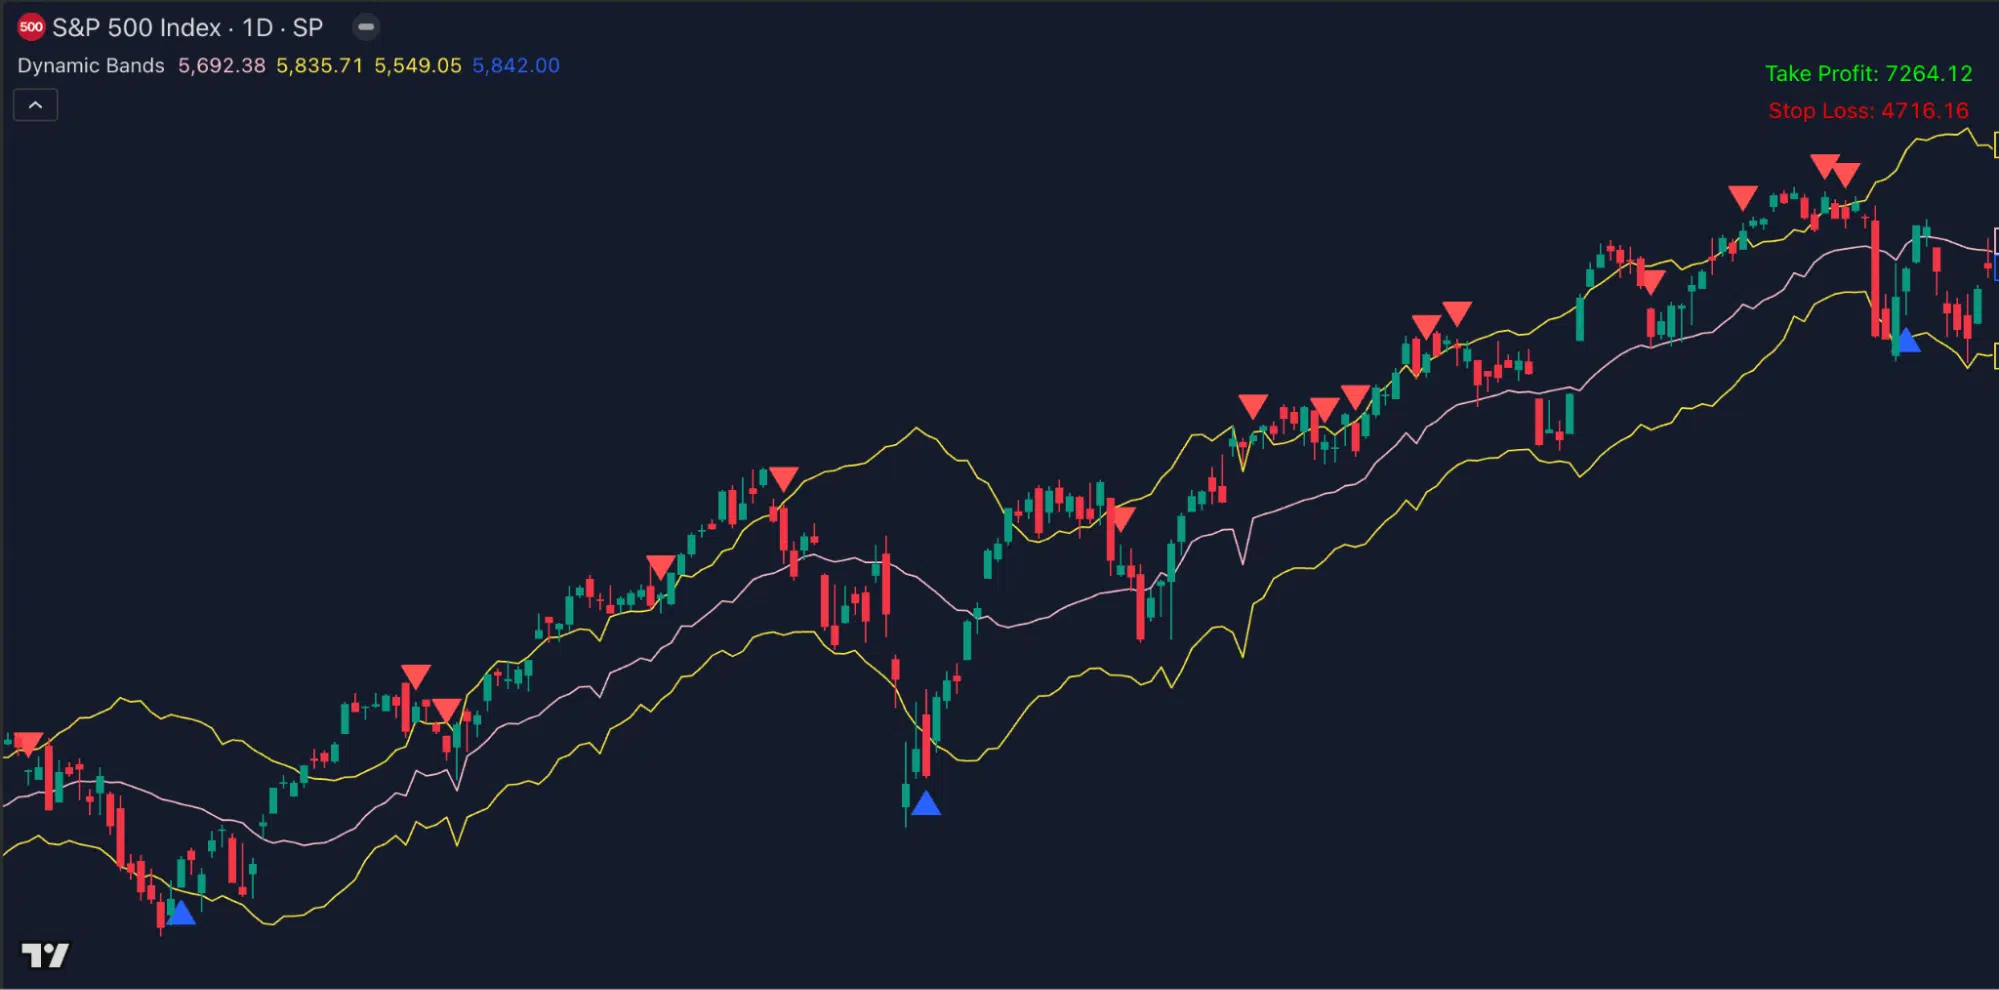
Let’s have a look at this powerful indicator in action…
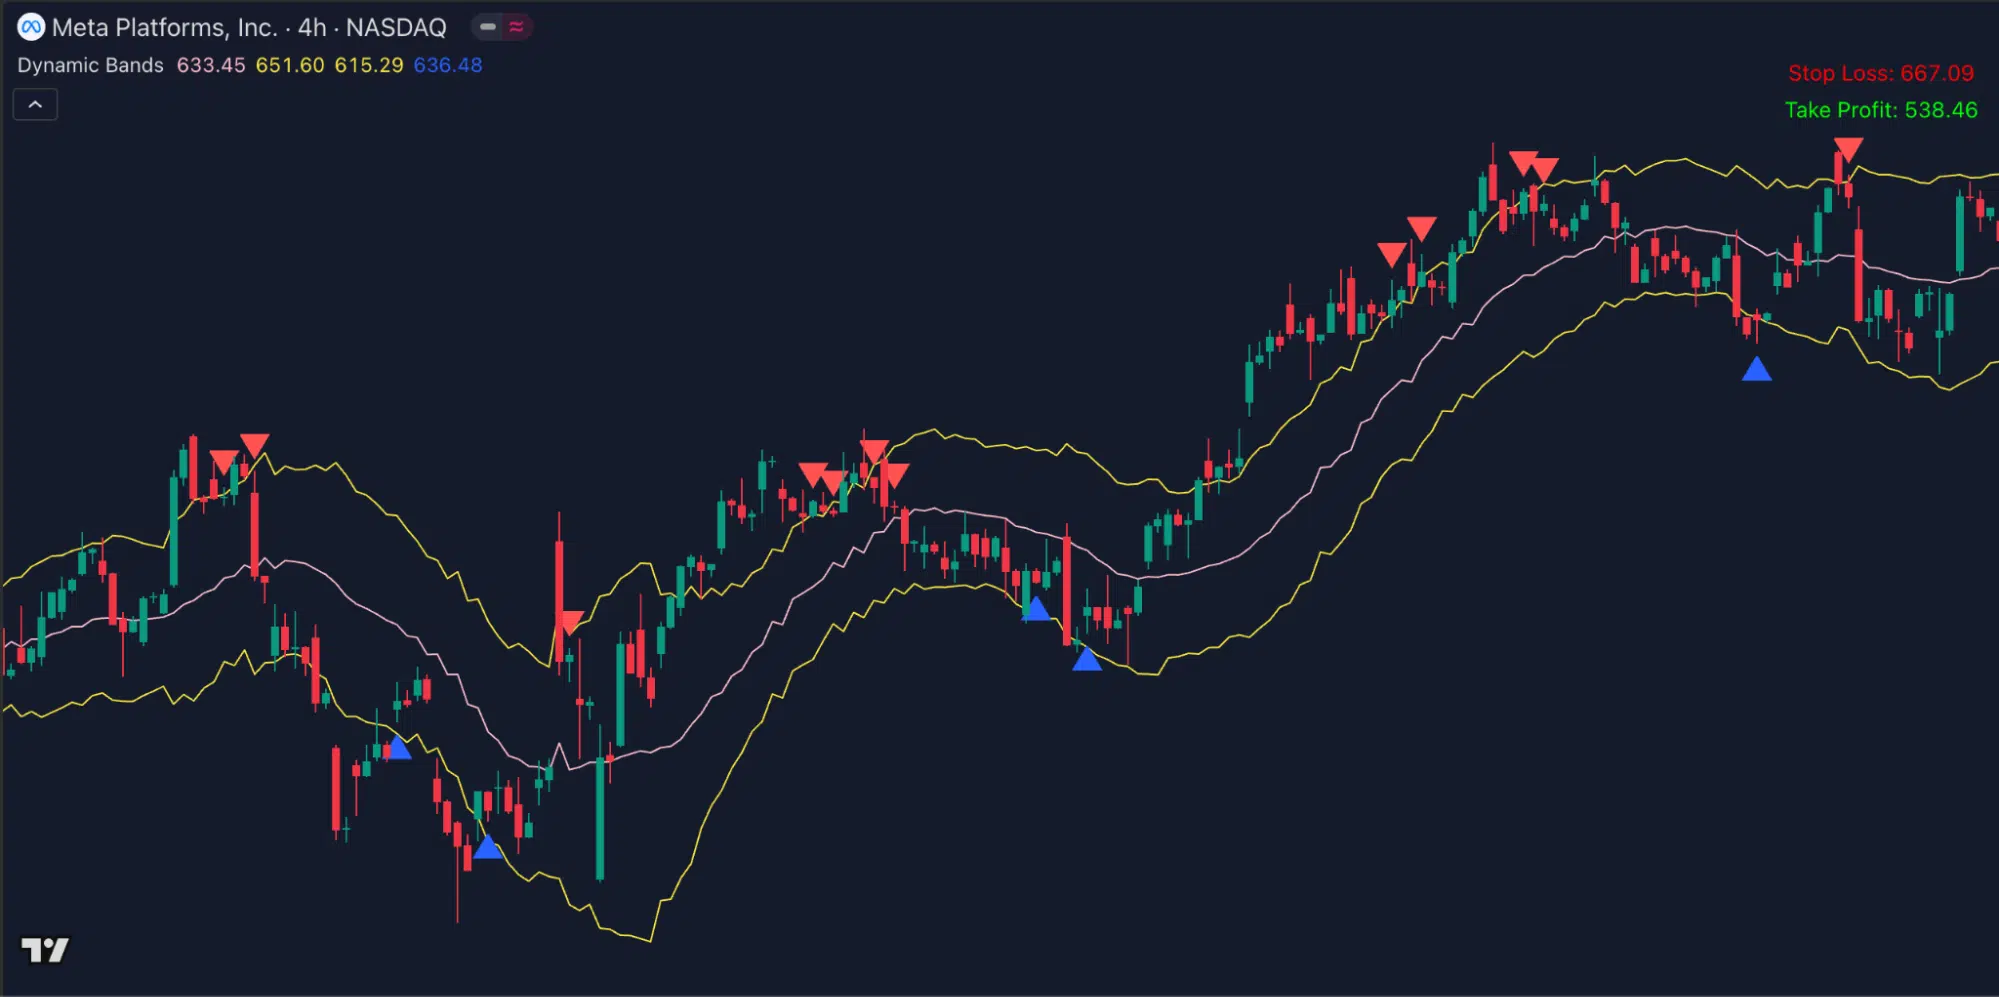
Many high-probability trade setups on 4H timeframe
Or excellent trade opportunities on daily timeframe
Impressive?
4. Your next step: Stop chasing fakeouts, start catching real moves
If you’ve been frustrated by whipsaws, fakeouts, and missed opportunities, it’s time to level up your trading strategy.
The Dynamic Bands Indicator is exactly what you need to start seeing more accurate trends, clearer entry signals, and fewer whipsaws. It’s time to stop chasing fake breakouts and start catching real moves that actually lead to profit.
Get the Dynamic Bands indicator for TradingView at the best price here