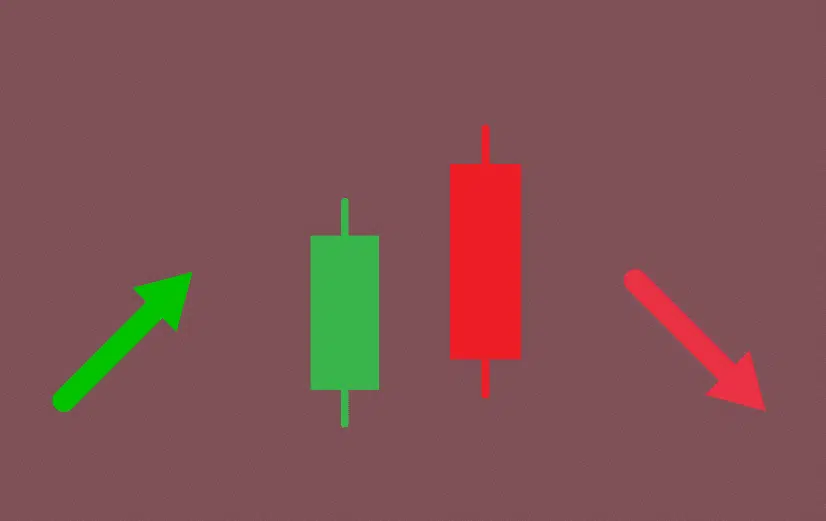
Trading bearish candlestick patterns can be a way to potentially profit from a downtrend in the market.
Table of Contents
1. What are Bearish candlestick patterns?
Trading professionals use candlestick patterns, a type of technical analysis, to analyze price changes in financial assets like stocks, currencies, commodities, and bonds. A series of candlesticks with a particular pattern that denotes a change in how prices move are combined to form candlestick patterns. Depending on the circumstances in which a pattern appears, such as the market’s trend, the volume of trades, and other technical indicators, its meaning will vary.
See more:
Candlestick Patterns Basic But Useful Understanding For Beginner
Riding The Bull: Bullish Candlestick Patterns For Trading Success

A price chart pattern known as a bearish candlestick pattern indicates a potential continuation of a downtrend or reversal of an uptrend. They are referred to as “bearish” because they suggest that the sellers (or bears) are in charge of the market and that prices will probably decrease.
To confirm potential trend reversals, bearish candlestick patterns are frequently used in conjunction with other technical analysis tools. You can use signals from bearish candlestick patterns to sell or short an asset.
2. Top 5 Bearish candlestick patterns
Bearish Engulfing Pattern

This pattern develops when a small bullish candle is followed by a larger bearish candle that completely engulfs the first candle. The lower low and lower high of the bearish candle compared to the preceding bullish candle indicate a change in momentum from bullish to bearish. Frequently, traders analyze this pattern as a signal to short or sell the asset.
Evening Star Pattern

This pattern occurs when a long bullish candle is followed by a small-bodied candle, indicating indecision in the market, and then followed by a long bearish candle. The small-bodied candle can be bullish or bearish, but it shows that the previous uptrend’s momentum is slowing down. The long bearish candle indicates that the bears are in charge and that there may be a reversal.
Dark Cloud Cover Pattern
A long bullish candle followed by a long bearish candle that opens above the high and closes below the midpoint of the previous day forms this pattern. The pattern indicates that the bears are in charge and that a possible reversal may take place.
Hanging Man Pattern
This pattern develops when an uptrend is followed by the appearance of a small-bodied candle with a long lower wick. The long lower wick shows that although at some point during the day buyers were able to raise the price, the bears ultimately gained control and drove the price lower.
Shooting Star Pattern
This pattern appears after an uptrend when a small-bodied candle with a long upper wick appears. The price rose significantly during the day, but the long upper wick shows that the bears were able to drive the price lower by the day’s end.
Each bullish candlestick pattern’s components are listed in the table below:
3. Trade with Bearish candlestick patterns
Trading Bearish candlestick patterns is the same as Bullish candlestick patterns, or candlestick patterns in general. The strategy can be summarized in four simple steps:
Step 1: Identify the bullish candlestick pattern
The first step in trading a bearish candlestick pattern is to identify the pattern on a chart. Look for patterns such as the Bearish Engulfing, evening Star, Dark Cloud Cover, Hanging Man, or Shooting Star.
- The Bearish Engulfing pattern consists of a small bullish candle followed by a larger bearish candle that completely “engulfs” the previous candle. The bearish candle has a lower low and a lower high than the previous bullish candle, indicating a shift in momentum from bullish to bearish.
Don’t have time to identify every single pattern? You can use the Candlestick Pattern Pro – an indicator that is designed to help you with all aspects of candlestick patterns, including all Bearish candlestick patterns.
This indicator can:
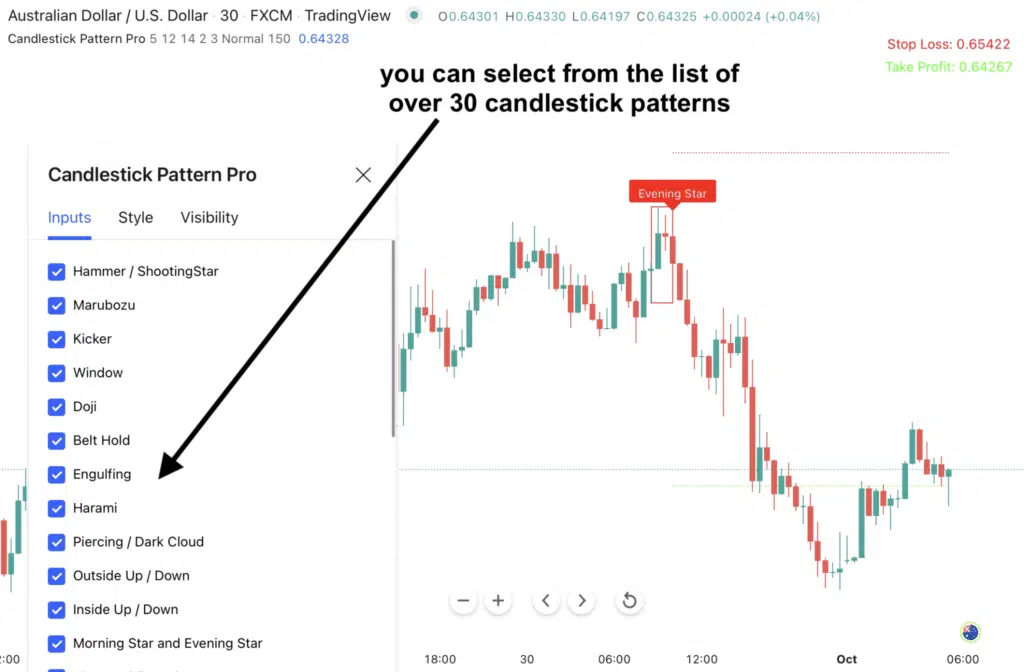
- Easily spot over 30 candlestick patterns, including all common BEARISH candlestick patterns.
- Display detected patterns beautifully on the chart.
- Timely notify you whenever a new zone is established.
Use the Candlestick Pattern Pro indicator to save a ton of time. You have more time now to analyze the market and spot profitable trading opportunities.
Step 2: Look for confirmation
Once you’ve identified a potential bearish candlestick pattern, look for additional confirmation to increase your confidence in the trade. Confirmations can include technical indicators, support and resistance levels, or other candlestick patterns.
- You confirm the Bearish Engulfing pattern by checking other technical indicators, such as the relative strength index (RSI) or moving averages, which also suggest that the asset is overbought and due for a pullback.
Bearish candlestick patterns will be displayed beautifully and with a high degree of probability on the chart with the aid of the Candlestick Pattern Pro indicator, no more confirmation is needed.
Step 3: Determine your entry and exit points
Once you’ve confirmed the pattern, determine the entry point for your trade. This may involve setting a limit order to enter the trade at a specific price or waiting for the price to break below a key support level.
- You determine the entry point for your trade by setting a limit sell order at $60, which is below the low of the bearish candle in the Bearish Engulfing pattern.
Step 4: Monitor your trade and use appropriate risk management
To manage your risk and potential losses, set stop loss and take profit levels for your trade. Once you’ve entered the trade, manage it by monitoring the price action and adjusting your stop loss and take profit levels if necessary.
- To manage your risk, you set a stop loss at $65, which is above the recent high of the stock, and set a take profit level at $55, which is a key support level. You monitor the price action and adjust your stop loss and take profit levels as necessary, eventually exiting the trade at $55 when the price hits your take profit level.
4. The bottom line
Whether you’re an experienced trader or a beginner, learning how to use bearish candlestick patterns will improve your ability to confidently analyze the markets and increase your chances of success. Combining these patterns with other technical analysis methods, paying attention to the market context, and keeping up with news events can help traders improve their trading and make better decisions.
To increase their chances of success, traders frequently seek confirmation from other technical indicators before acting on a bearish candlestick pattern. The Candlestick Pattern Pro indicator will be of great assistance to your candlestick trading.