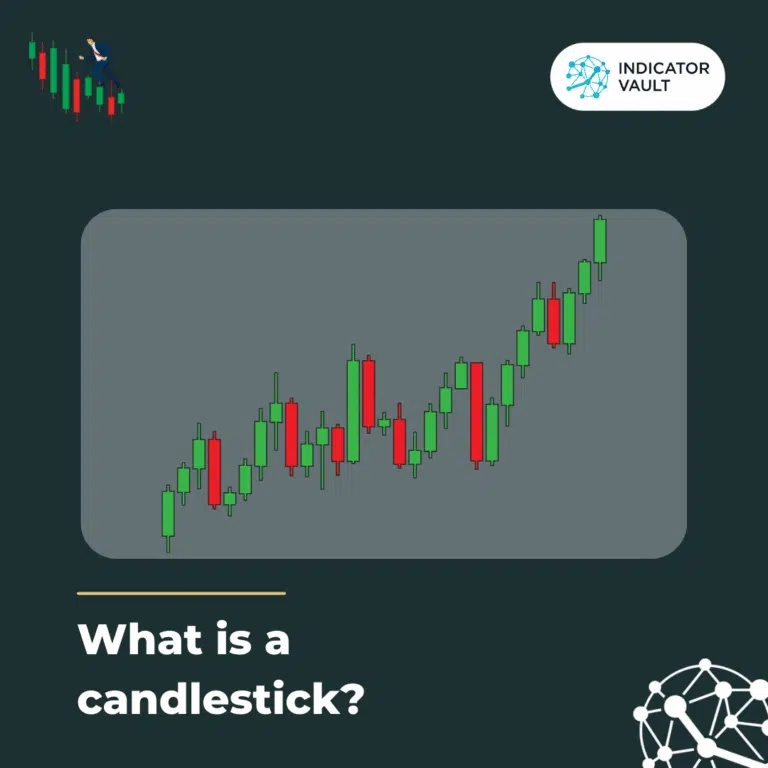
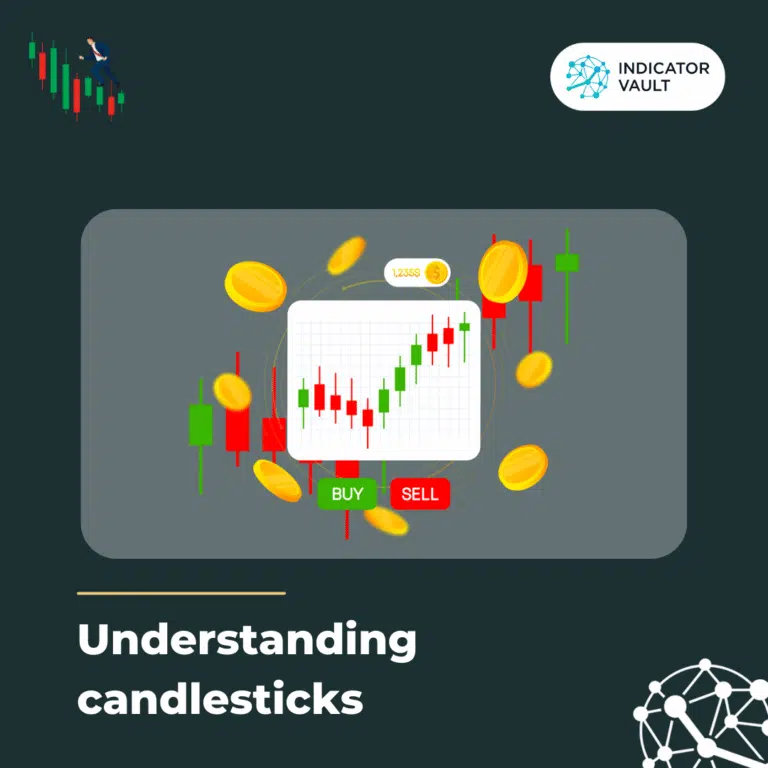
What is a candlestick and why does it matter in trading? Technical analysts rely on candlestick charts and candlestick patterns to help them time their trades and see how investors’ emotions affect price movements. Based on a method established in Japan in the 1700s for monitoring rice prices, candlestick charting remains one of the most popular ways to display market data today.
If you’ve ever asked what is a candlestick, the answer is simple: it is a type of financial chart used to track market prices and daily momentum. Originating from Japanese rice merchants in the 1700s, a candlestick shows the highest, lowest, opening, and closing prices of a security or currency during a certain time period.
So, what is a candlestick used for in modern trading?
Traders use candlestick charts in technical analysis to forecast potential price changes based on historical behavior and repeating patterns.
Candlesticks display four key price points over a chosen timeframe: open, high, low, and close prices .
The “real body” of the candlestick is the wide, rectangular section that connects the opening and closing prices. This real body portrays the price range between the opening and closing prices of the trading.
Just above and below the real body are the “shadows” or “wicks.” These thin, vertical lines show the high and low prices of that period’s trading. During the trading session, the upper shadow represents the high price, and the lower shadow represents the low price.
To better understand what is a candlestick, you need to recognize its two main types:
A bullish candle has a white or green real body, indicating that the closing price is higher than the opening price. This means buyers pushed the price upward during the session.
A bearish candle has a red or black real body, meaning the closing price is lower than the opening price. This reflects selling pressure dominating the session.
By reading the body size and wick length, traders can quickly interpret market strength, weakness, or indecision.
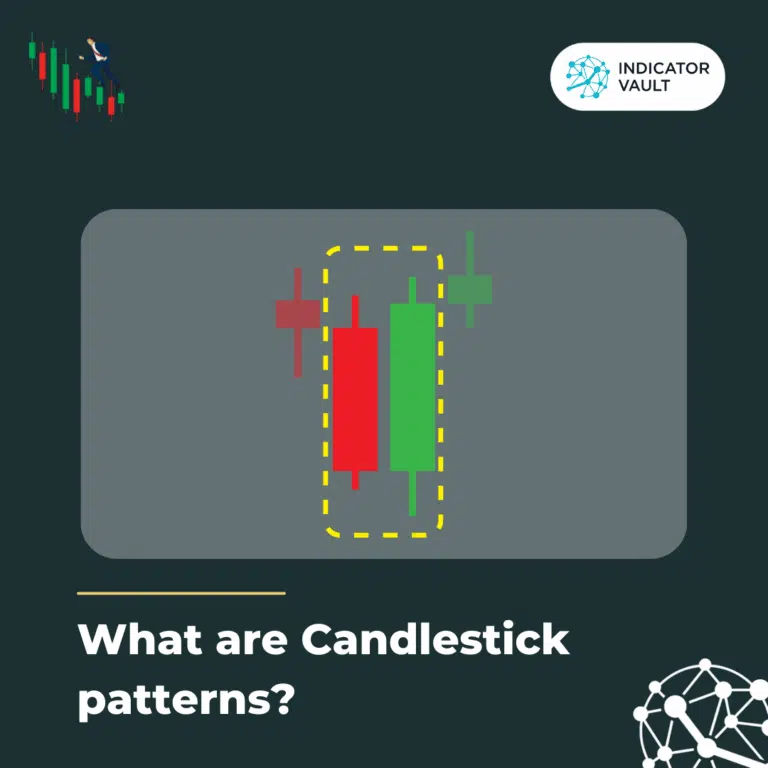
Once you understand what is a candlestick, the next step is learning how individual candles combine into patterns.
Over time, individual candlesticks develop patterns that traders may use to identify important support and resistance levels. Opportunities may be found in the market through a variety of candlestick patterns; some reveal the relative strength of buyers and sellers, while others reveal continuation patterns or market hesitation.
Currently, there are many candlestick patterns that each signals a different outcome. In general, candlestick patterns can be categorized into:
Before identifying any candlestick patterns, traders should look for a prior trend first. A bullish reversal requires a preceding downtrend, while a bearish reversal requires an uptrend.
When a bullish reversal candlestick pattern appears, it means the current downtrend is about to turn into an uptrend.
So, when bullish reversal candlestick chart patterns are detected, traders should be wary of taking short positions.
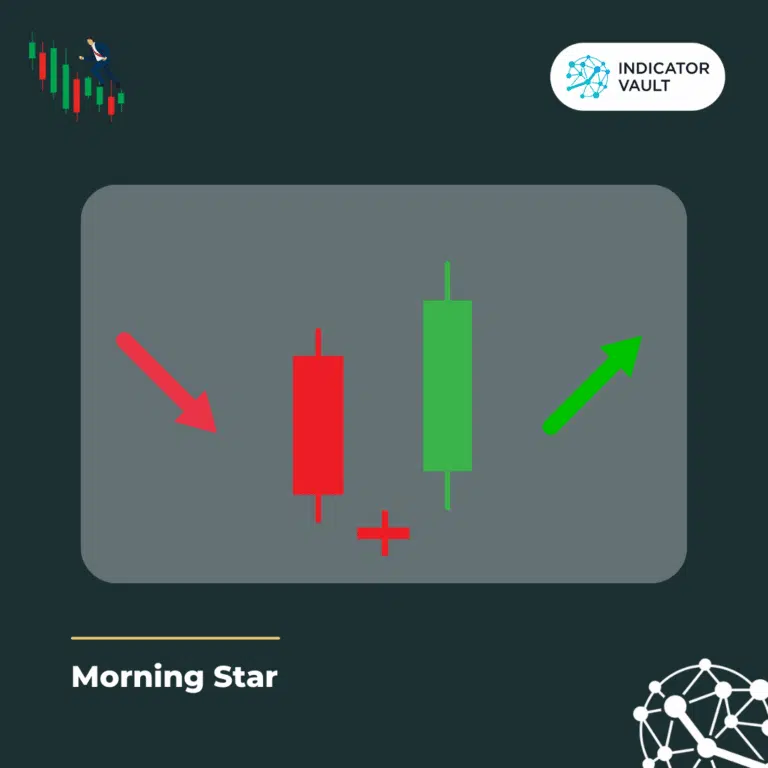
The Morning Star is a candlestick chart pattern indicating a bullish reversal. It is regarded as a sign of hope in a market downtrend. The pattern consists of 3 candles with one short-bodied candle in the middle of a long red and a long green candle.
The first candle represents the uptrend’s continuance. The middle one suggests market uncertainty. The third bullish candle indicates that buyers have returned to the market, signaling a possible trend reversal.
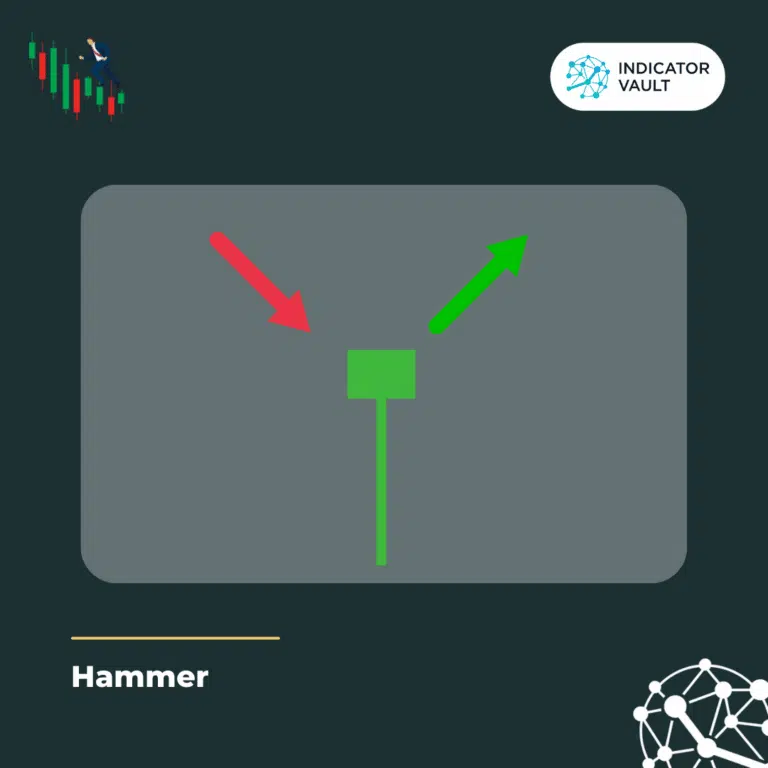
Hammer is a single candlestick pattern that indicates a bullish reversal and is created at the end of a downtrend. This candle’s real body is small and positioned at the top, while its lower shadow is more than double the size of the real body. This pattern has no or a little upper shadow.
A hammer indicates that the price moved down throughout the day but then backed up as a result of intense buying demand. The color of the body might vary, but green hammers imply a stronger bull market.
After an uptrend, bearish candlestick patterns typically appear and indicate a point of resistance. When traders are extremely bearish about the market price, they frequently close their long positions and replace them with short ones in order to profit from the price decline.
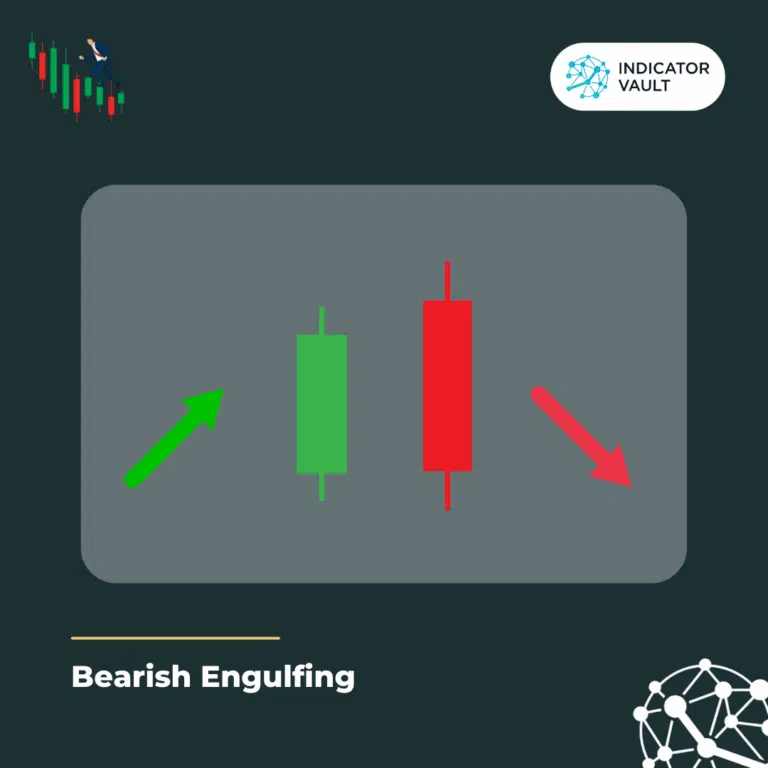
Bearish Engulfing is a multiple candlestick pattern that appears at the end of an uptrend. It’s made up of two candles; the first one has a green body that is engulfed by the longer second, which is red.
It indicates a price peak or slowdown and suggests a forthcoming market downturn. If the second candle closes lower than the first, the trend is more likely to be substantial.
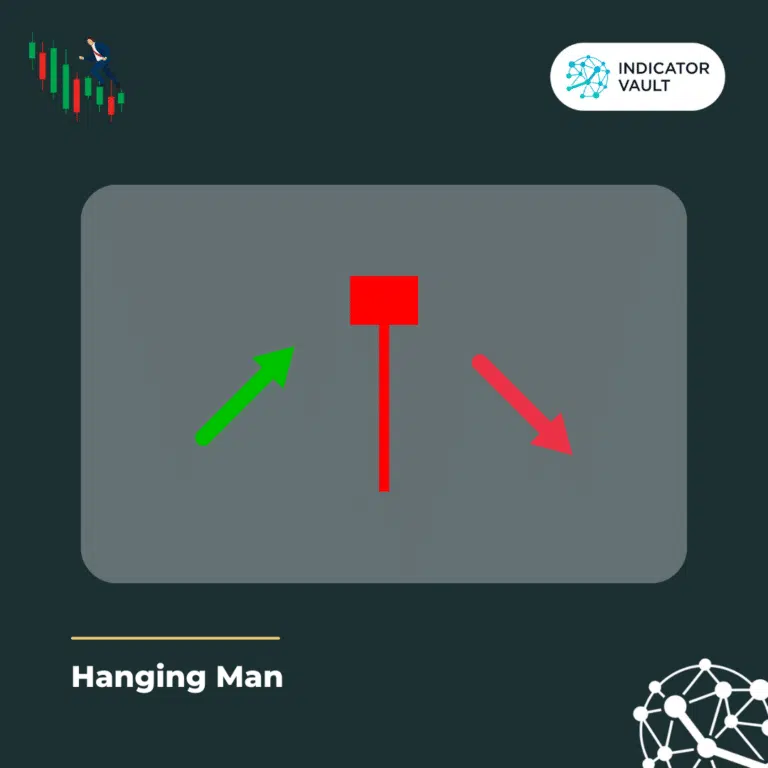
Hanging Man is a single candlestick pattern that indicates a bearish reversal. To put it another way, this pattern is the bearish counter to a hammer, with the same basic shape but appearing at the end of an uptrend.
It suggests a big sell-off occurred during the day but that buyers eventually succeeded in driving the price back up. Investors have seen the sharp decline as evidence that bulls are losing ground on the market.
A candlestick pattern is considered to be a continuation pattern if it does not signal a reversal in market momentum. These can be used by investors to spot a time of calm in the market, when prices are not moving significantly up or down.
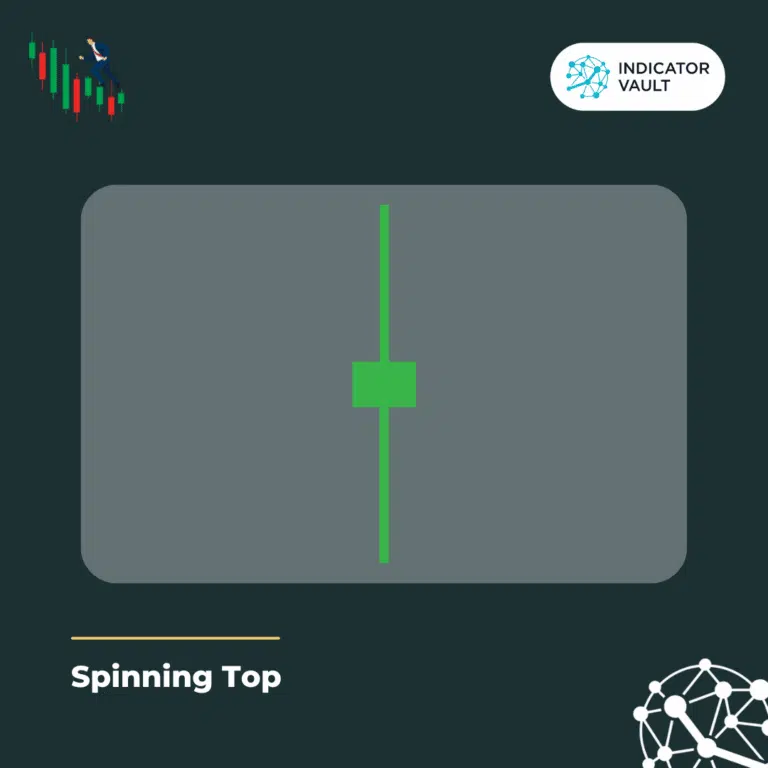
Spinning Top pattern has a short real body and two equal-length shadows. No significant price movement has occurred as a result of the pattern, suggesting market indecision.
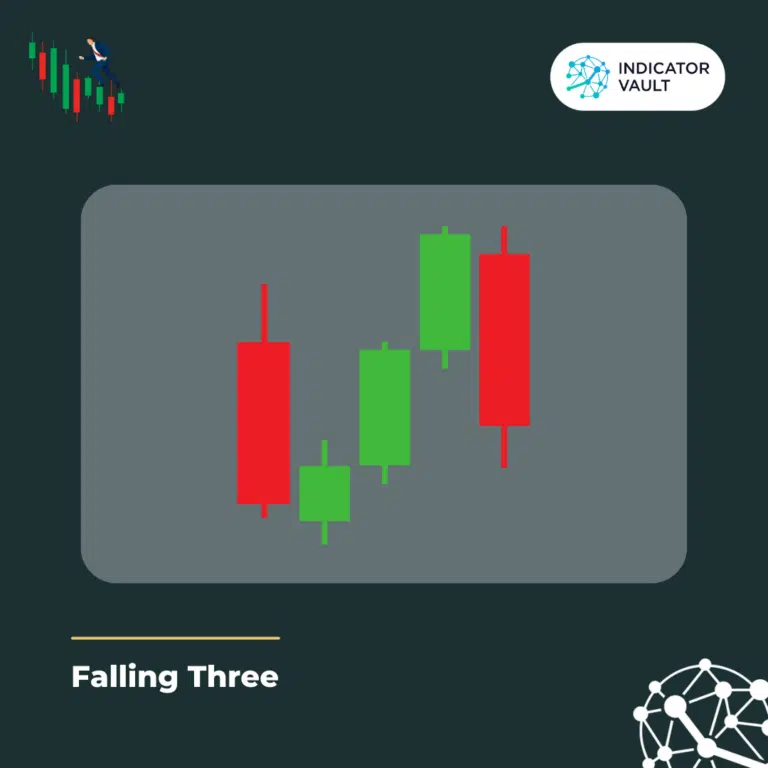
Five candles forming a “Falling Three” pattern indicate a pause in the downtrend rather than a reversal. For traders, this means that the bulls do not have enough momentum to reverse the trend.
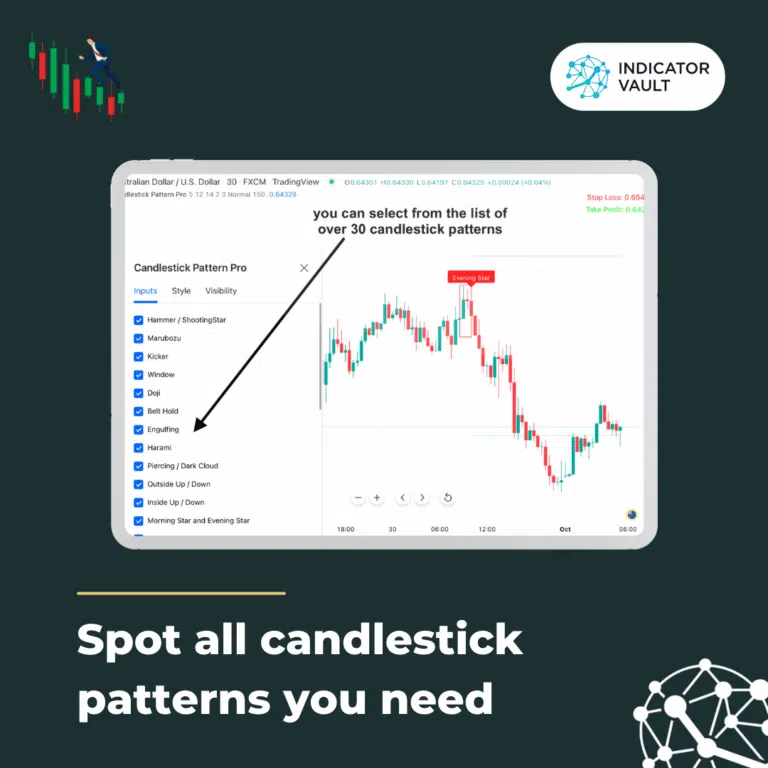
As previously mentioned, there are a number of different candlestick patterns, and it would be impossible for a trader to memorize their individual characteristics. Let me recommend the Candlestick Pattern Pro indicator from Indicator Vault to assist you with it. This indicator can:
Save tons of your time while using the Candlestick Pattern Pro indicator. Now you have more time to determine the market and capture good setups for a winning trade.
So, what is a candlestick in trading? It’s a simple yet powerful visual tool that shows market psychology through price action.
By understanding candlestick structures and patterns, traders can make more informed decisions and improve timing.
And with the help of the Candlestick Pattern Pro indicator, you can identify high-probability setups faster and trade with greater confidence.
Also, follow us for all the promotions and other useful topics: