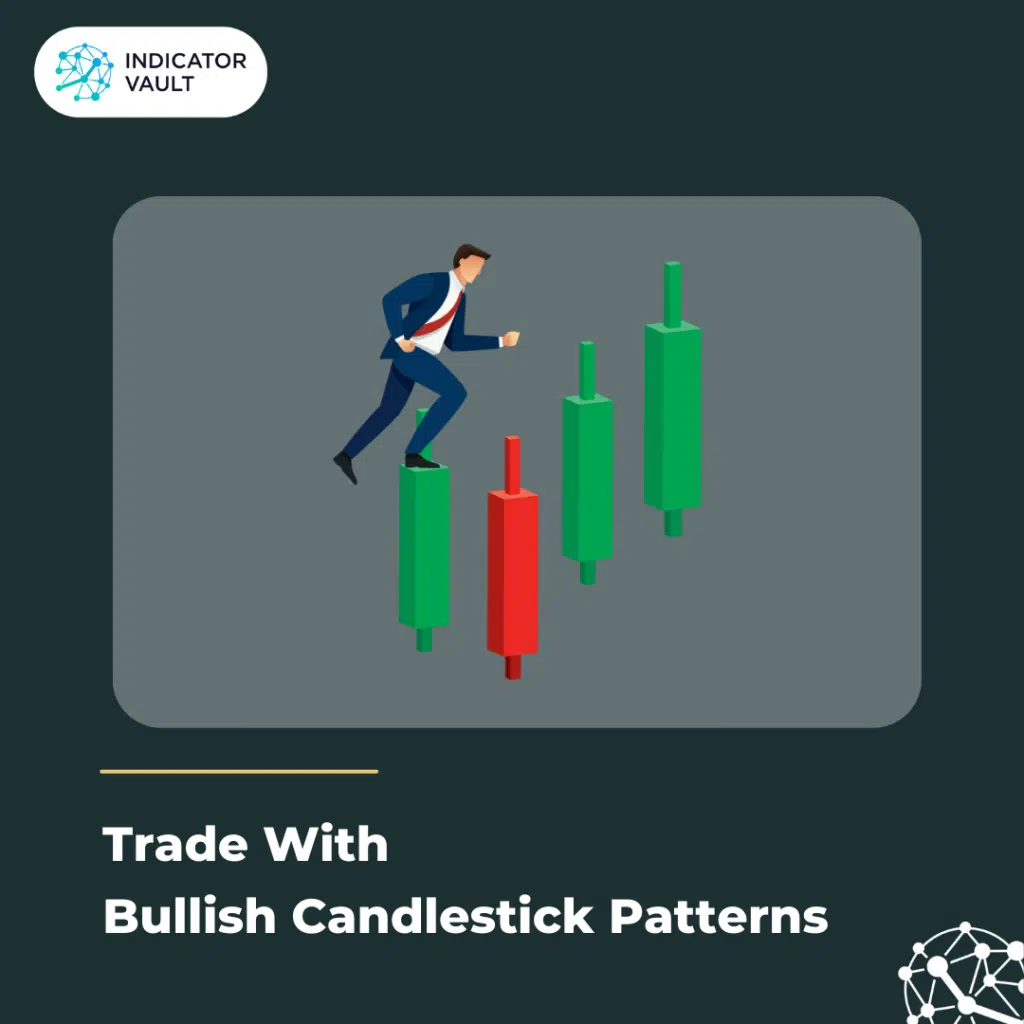
Trading with bullish candlestick patterns can be an effective strategy for identifying potential buying opportunities in the market.
Table of Contents
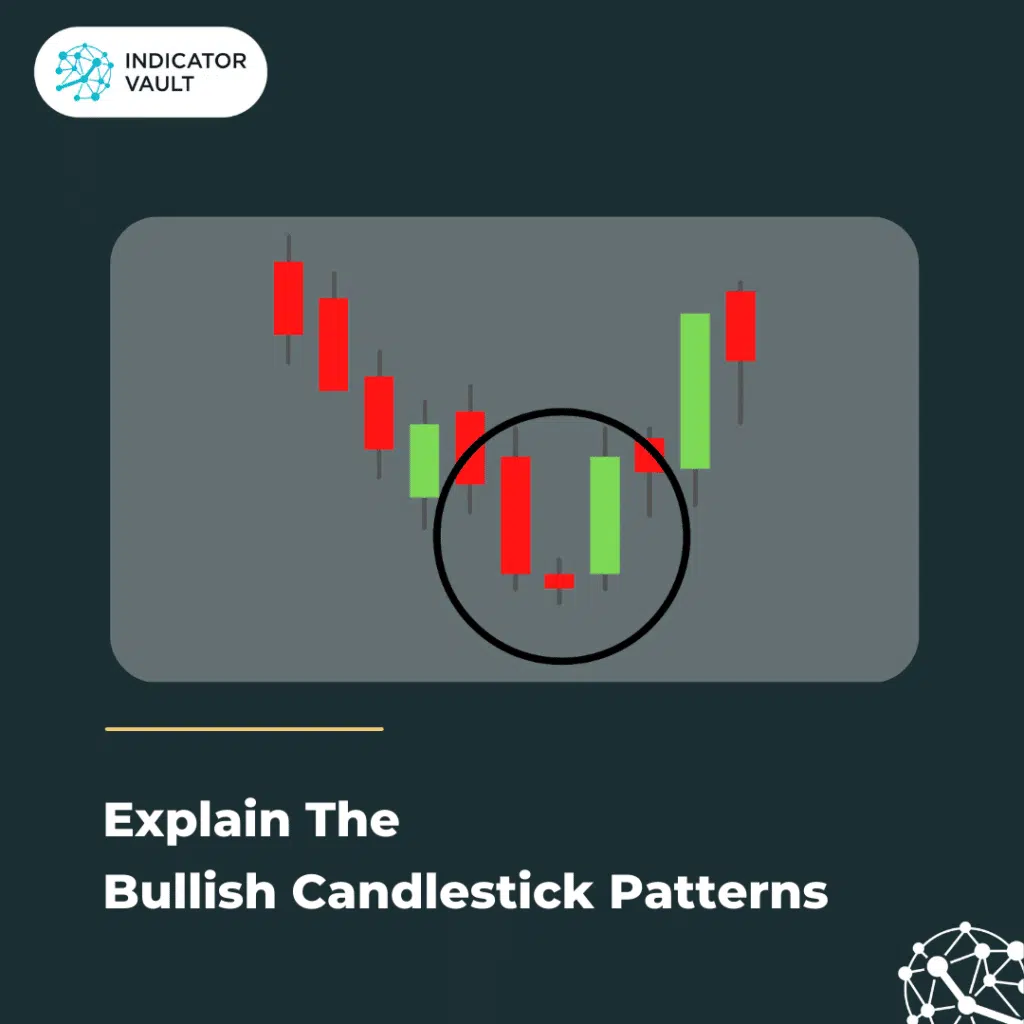
1. Explain the Bullish Candlestick Patterns
Candlestick patterns are a type of technical analysis that traders use to examine price changes of financial assets such as stocks, currencies, commodities, and bonds. Candlestick patterns are made up of a series of candlesticks showing certain patterns that indicate a change in the way prices move. Each pattern’s meaning depends on the situation in which it appears, such as the market’s trend, the number of trades, and other technical indicators.
See more:
Candlestick Patterns Basic But Useful Understanding For Beginner – Indicator Vault
Bearish Candlestick Patterns: Successful Downtrend Trading – Indicator Vault
Bullish candlestick patterns are price patterns that indicate either that an uptrend is likely to continue or that the market may be switching from a downtrend to an uptrend. These patterns, which are made up of a series of candlesticks, show buying pressure and may forecast a rise in the price of the underlying asset.
You can employ bullish candlestick patterns to forecast price swings in the future and spot possible buying opportunities. To confirm or invalidate a pattern and to make trading decisions, bullish candlestick patterns may be used in conjunction with other technical analysis tools like trend lines, moving averages, and oscillators.
2. Top 5 Bullish Candlestick Patterns
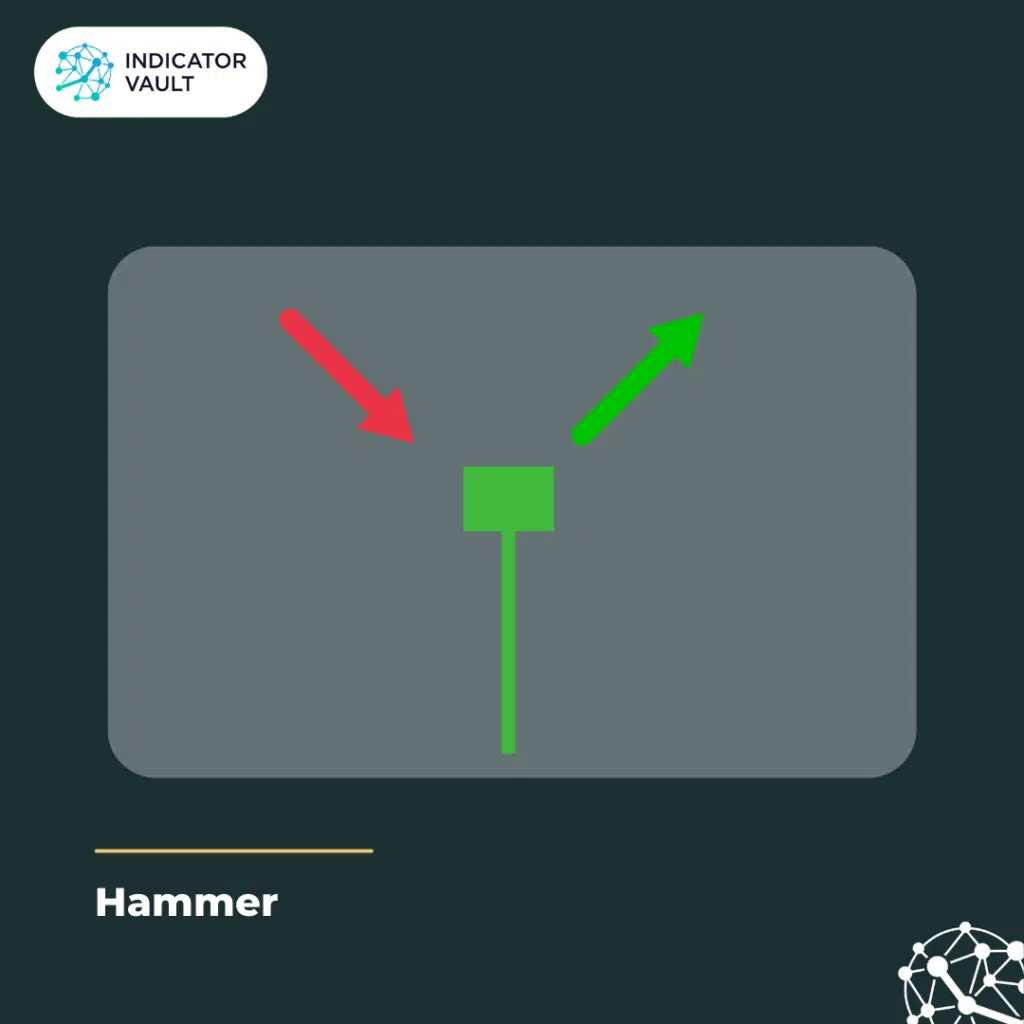
2.1 Hammer Pattern
A hammer is a single candlestick pattern that appears at the end of a downtrend. It contains a small body with little to no upper shadow and a long lower shadow. The pattern signals that the trend may be changing and that the bulls are beginning to take control.
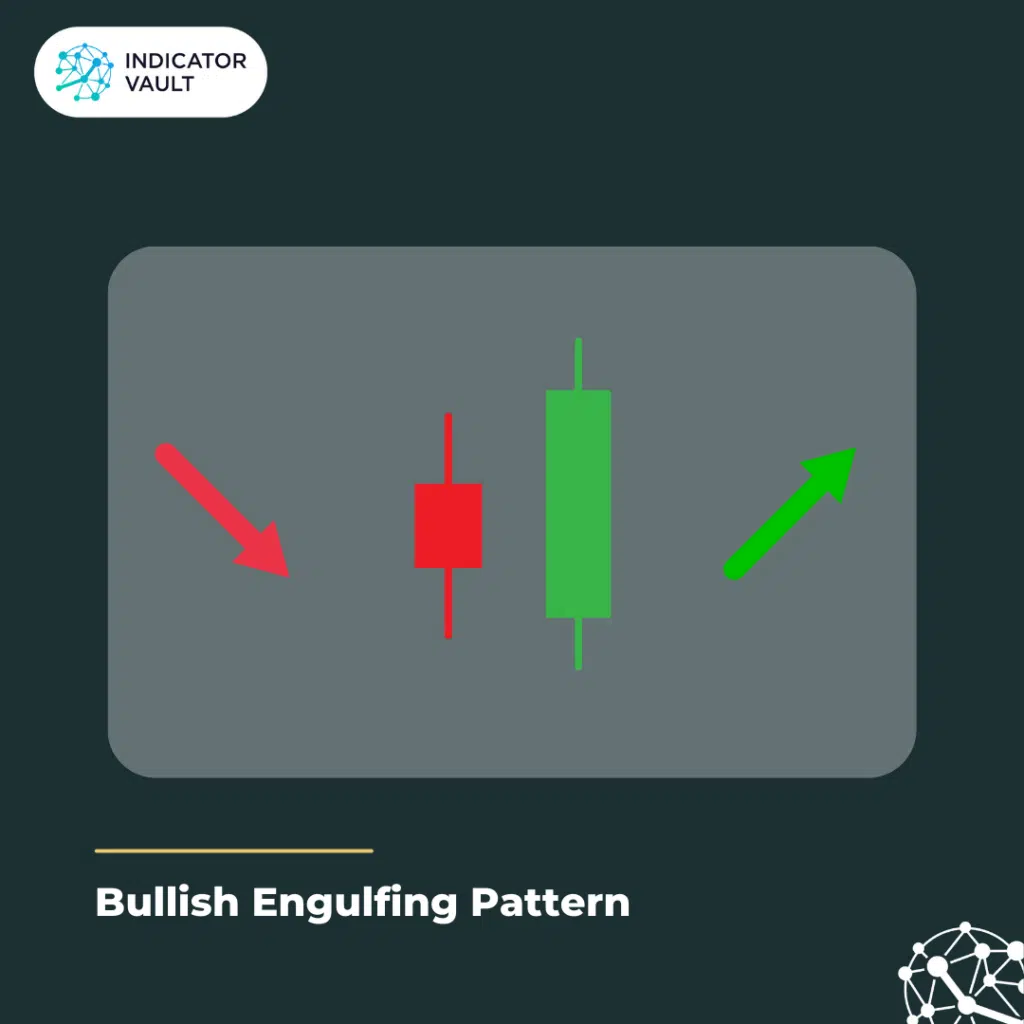
2.2 Bullish Engulfing Pattern
A small bearish candle is followed by a bigger bullish candle to form the two-candle bullish engulfing pattern. The previous bearish candle is totally engulfed by the following bullish candle, signaling that the bulls are now in charge of the market.
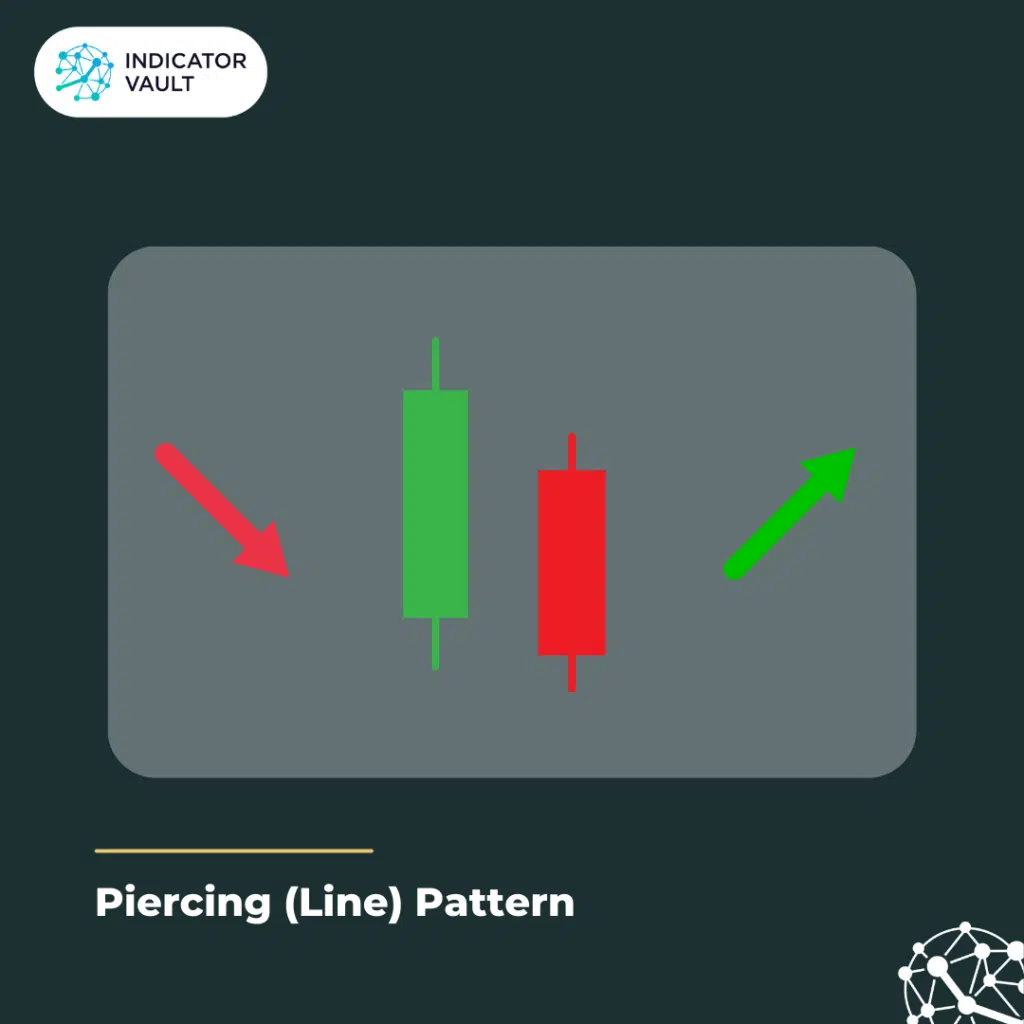
2.3 Piercing Pattern
The piercing pattern, which is a two-candle pattern, develops when a long bearish candle is followed by a bullish candle that opens below the close of the previous candle, but closes above the midpoint of the previous candle’s body. This pattern shows that the trend may be reversing and that the bulls are starting to gain control.
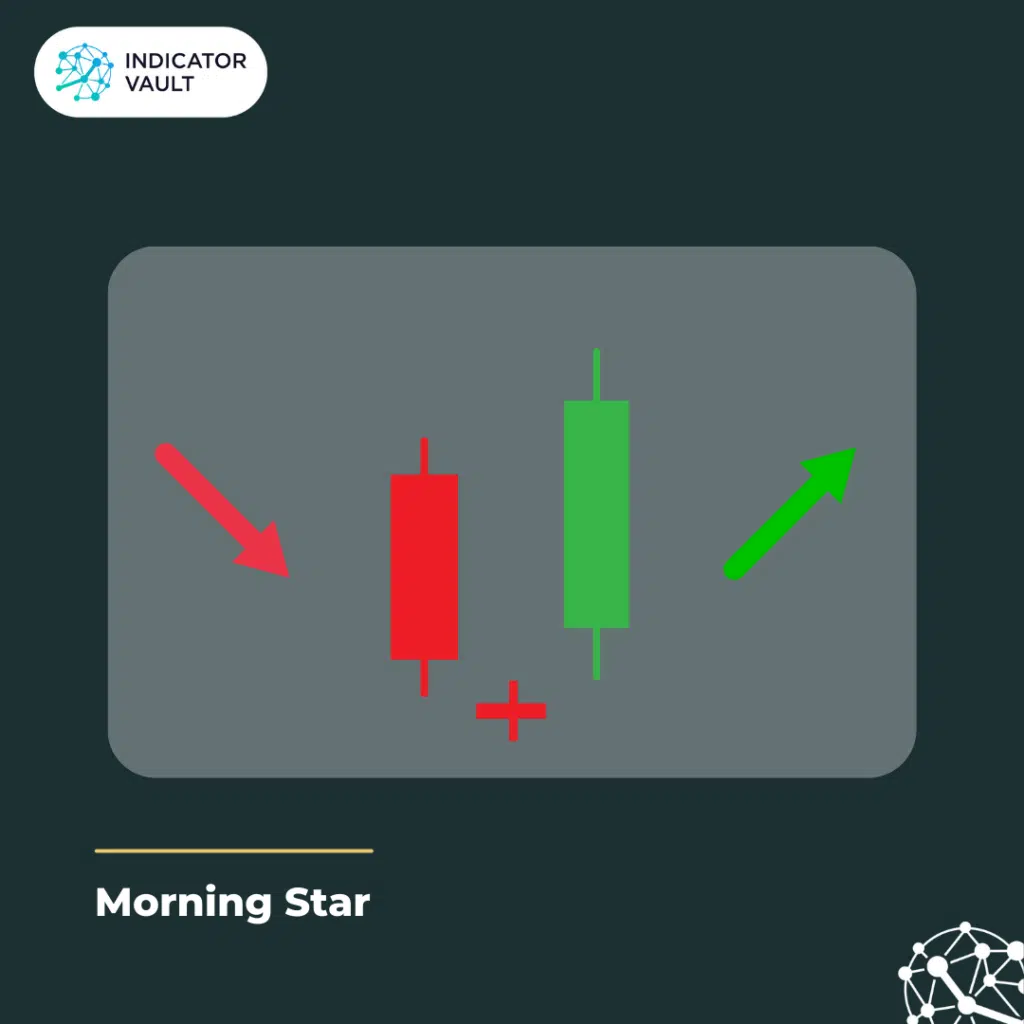
2.4 Morning Star
A three-candle pattern known as the morning star appears at the end of a downtrend. The first candle is a long bearish candle, the second one is a small bearish or bullish candle, and the third candle is a long bullish candle that opens over the high of the previous candle. This pattern indicates that the bears may be losing the upper hand and that the bulls may be taking control.
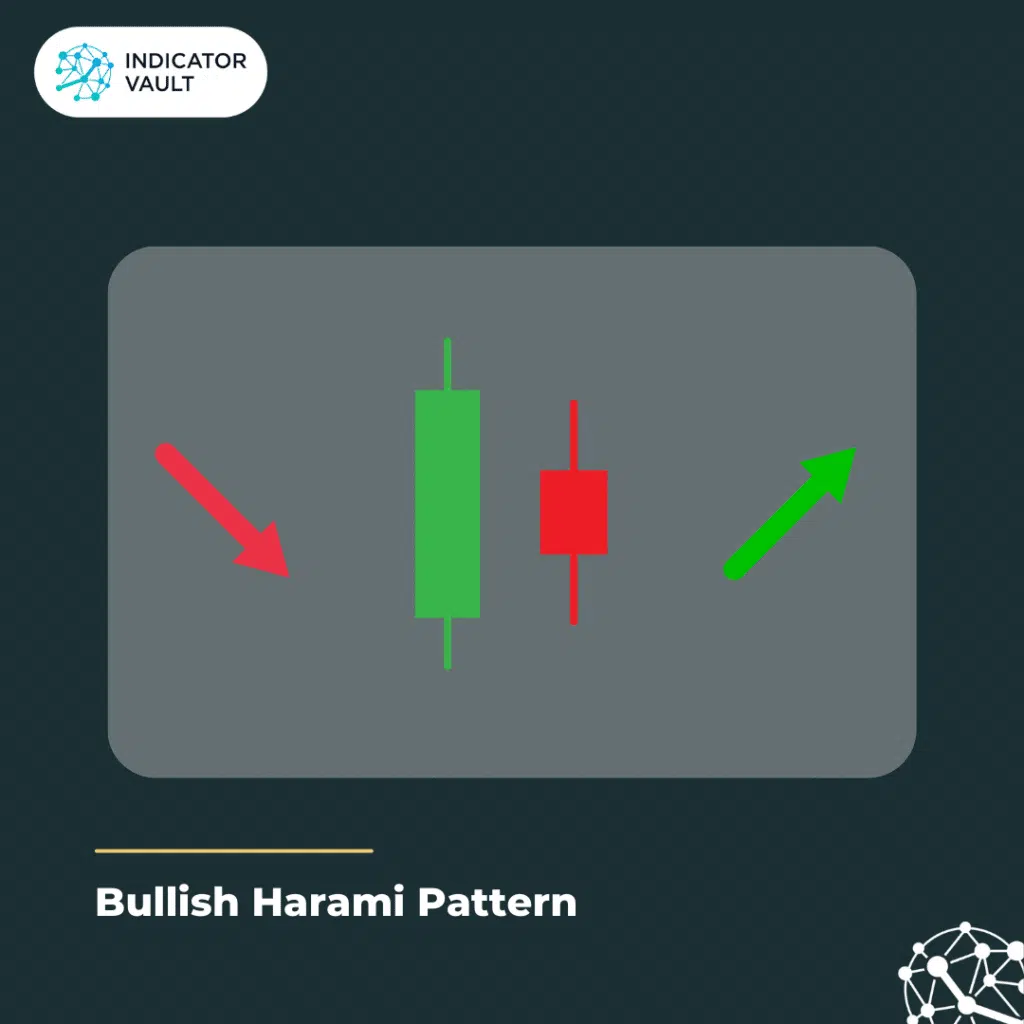
2.5 Bullish Harami
When a small bearish candle is followed by a small bullish candle that is entirely contained within the previous candle’s body, a two-candle pattern known as the bullish harami is formed. This pattern indicates that the bulls may be taking control and that the trend may be shifting.
This table below summarizes the elements of each bullish candlestick pattern:
See more:
Using Bullish Candlestick Patterns to Buy Stocks – Investopedia
3. Trade with Bullish Candlestick Patterns
3.1 Identify the bullish candlestick pattern
Each pattern has its own unique criteria that must be satisfied in order for it to be regarded as a valid signal.
- One example of a bullish candlestick pattern is the “hammer,” which has a small body and a long lower shadow, indicating that buyers have pushed the price up from its low point.
- Another example is the “bullish engulfing” pattern, where a small bearish candle is followed by a larger bullish candle that completely engulfs it, suggesting a reversal in trend.
Don’t have time to identify every single pattern? You can use the Candlestick Pattern Pro – an indicator that is designed to help you with all aspects of candlestick patterns. This indicator can:
- Easily spot over 30 candlestick patterns, including all common bullish candlestick patterns.
- Display detected patterns beautifully on the chart.
- Timely notify you whenever a new zone is established.
Use the Candlestick Pattern Pro indicator to save a ton of time. You have more time now to analyze the market and spot profitable trading opportunities.
3.2 Look for confirmation
Once you’ve identified a potential bullish candlestick pattern, look for confirmation from other indicators, such as a moving average crossover or a trend line breakout.
Let’s say you’ve identified a bullish hammer pattern on a daily chart for a particular stock. To confirm this signal, you could look for other indicators, such as:
- A break above a trend line: If the price is below a downward sloping trend line, a break above this line could confirm the bullish hammer signal and suggest a trend reversal.
- A moving average crossover: If a shorter-term moving average (such as the 50-day MA) crosses above a longer-term moving average (such as the 200-day MA), this could confirm the bullish signal.
Bullish candlestick patterns will be displayed beautifully and with a high degree of probability on the chart with the aid of the Candlestick Pattern Pro indicator, no more confirmation is needed.
3.3 Determine your entry and exit points
Once you’ve confirmed a bullish signal, determine your entry and exit points.
Let’s say you’ve identified a bullish piercing pattern on a 1-hour chart for a particular currency pair. To determine your entry and exit points, you could:
- Enter the trade at the open of the next candle after the piercing pattern appears, with a stop loss below the low of the previous red candle.
- Set a profit target based on the distance between the low of the previous red candle and the high of the green candle in the piercing pattern. For example, if this distance is 50 pips, you could set a profit target of 50 pips above your entry price.
- Use a trailing stop loss to lock in profits as the price moves higher. For example, you could move your stop loss to breakeven once the price has moved 25 pips in your favor, and then trail it 20 pips behind the current price as it continues to move higher.
3.4 Monitor your trade and use appropriate risk management
As you place a trade, keep a careful eye on it to make sure the market is still moving in a favorable direction. If the transaction doesn’t work out as you had hoped, use a stop-loss order to reduce your losses.
To monitor your trade and use appropriate risk management, you could:
- Use a risk-reward ratio of at least 1:2, which means that your profit target should be at least twice as far away from your entry point as your stop loss. For example, if your stop loss is 5% away from your entry price, your profit target should be at least 10% above your entry price.
- Set up price alerts to notify you if the price reaches your stop loss or profit target. Adjust your stop loss and profit target as the trade progresses.
- Check the news and economic calendar regularly to stay informed about any events that could affect the market. For example, if a major supply disruption occurs in the commodity’s industry, this could significantly impact the price and may prompt you to exit the trade.
4. The bottom line
Learning how to employ bullish candlestick patterns will allow you to analyze the markets more confidently and raise your chances of success whether you’re a beginner or experienced trader. Traders may improve their trading and make better selections by combining these patterns with other technical analysis techniques, paying attention to the market context, and following news events.
Before acting on a bullish candlestick pattern, traders often look for confirmation from other technical indicators to make sure they have a better chance of success. Your candlestick trading will also greatly benefit from the use of the Candlestick Pattern Pro indicator.