The Bollinger Bands strategy is one of the most popular technical tools among traders, but also one of the most misunderstood. While it helps visualize volatility and potential reversals, many traders still struggle with false breakouts, choppy sideways markét, and signals that come too late.
That’s where the MACD comes in. By combining Bollinger Bands and MACD, traders can identify momentum shifts and confirm true breakouts.
In this article, we’ll break down exactly how to do that, and introduce a modern tool that fuses both tools into one powerful system.
Table of Contents
1. What is the Bollinger Bands strategy?
The Bollinger Bands strategy is built around a simple yet powerful idea, markets move in waves, expanding and contracting around a moving average.
It uses three lines:
- The middle band (a 20-period simple moving average)
- The upper band (SMA + 2 standard deviations)
- The lower band (SMA − 2 standard deviations)
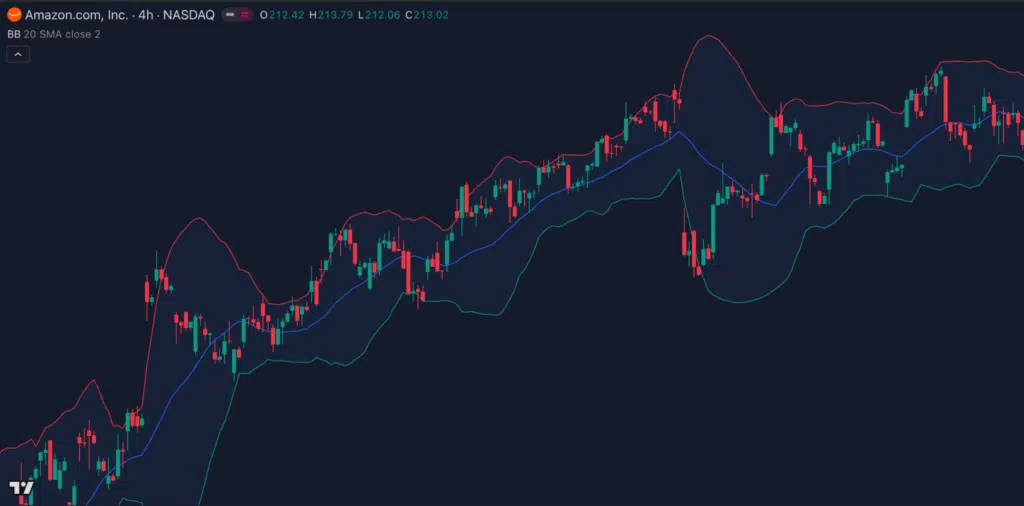
When price touches the upper band, it may be overbought; when it hits the lower band, it may be oversold.
Traders often use these levels to find reversal or breakout opportunities.
However, while Bollinger Bands visualize volatility well, they don’t confirm direction or momentum, which often leads to false entries.
2. Common problems with the Bollinger Bands strategy
Despite its simplicity, many trades fall into the same traps when using Bollinger Bands:
- False reversals: Price can ride along the upper or lower band for a long time, making early entries unprofitable.
- No trend confirmation: The Bands show volatility, not whether momentum supports the move.
- Poor in sideways market: During consolidations, signals become noisy and unreliable.
In short, Bollinger Bands alone show what’s happening, but not why or how strong the move is. That’s the missing piece MACD helps fill.
3. How MACD strengthens the Bollinger Bands strategy
The MACD measures momentum and trend strength by comparing two moving averages (typically 12 and 26 periods).
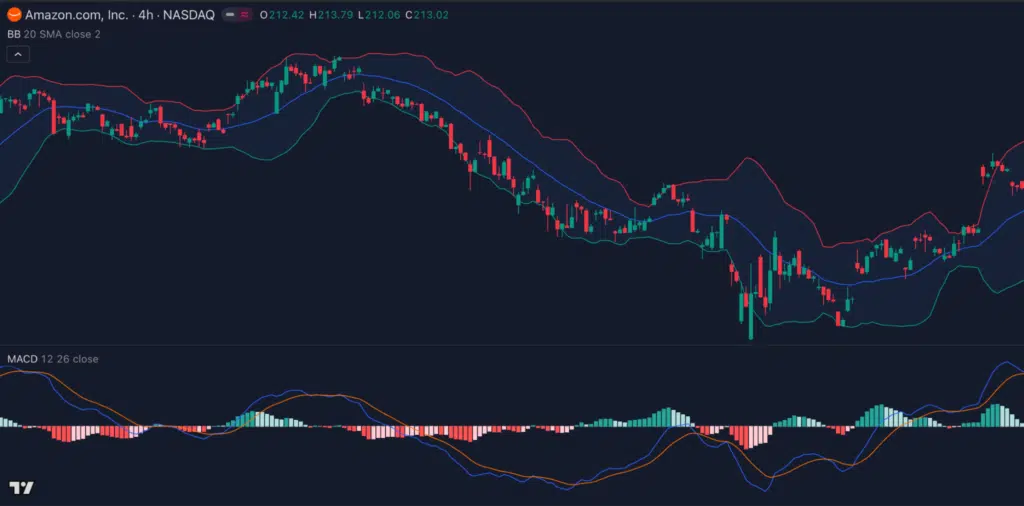
It adds an extra layer of confirmation to the Bollinger Bands setup:
- When price breaks above the upper band and MACD crosses above the signal line, it confirms bullish momentum
- When price breaks below the lower band and MACD crosses below the signal line, it signals strong bearish pressure.
This combination helps filter out false breakouts and ensures you only trade when both volatility and momentum align.
The result? Fewer fakeouts, stronger entries, and better timing.
4. The modern upgrade: Fusing Bollinger Bands and MACD into one tool
While using both indicators manually works, it’s not always efficient. That’s why modern traders turn to smart indicators that combine both systems automatically.
Introducing the MACD Bollinger PRO – an advanced TradingView indicator that merges the logic of Bollinger Bands and MACD into one clean interface.
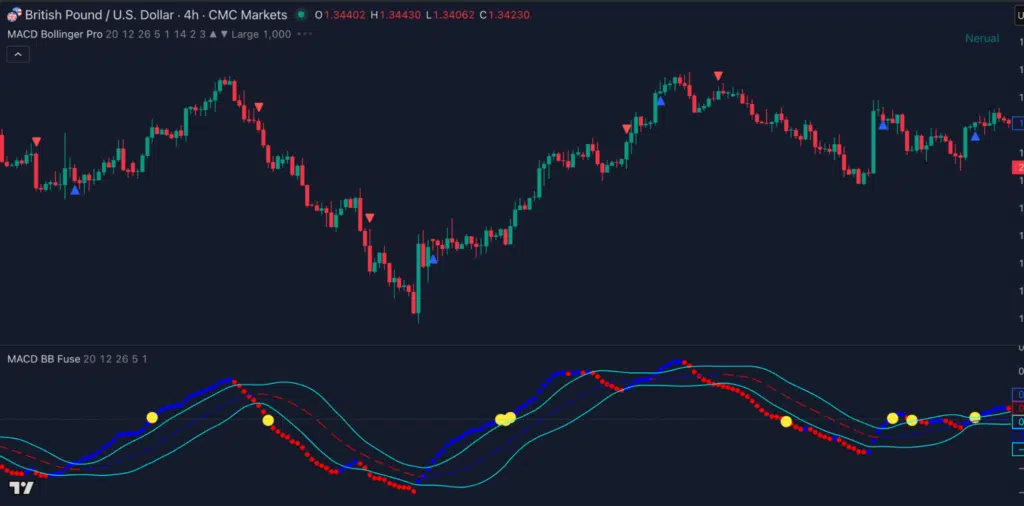
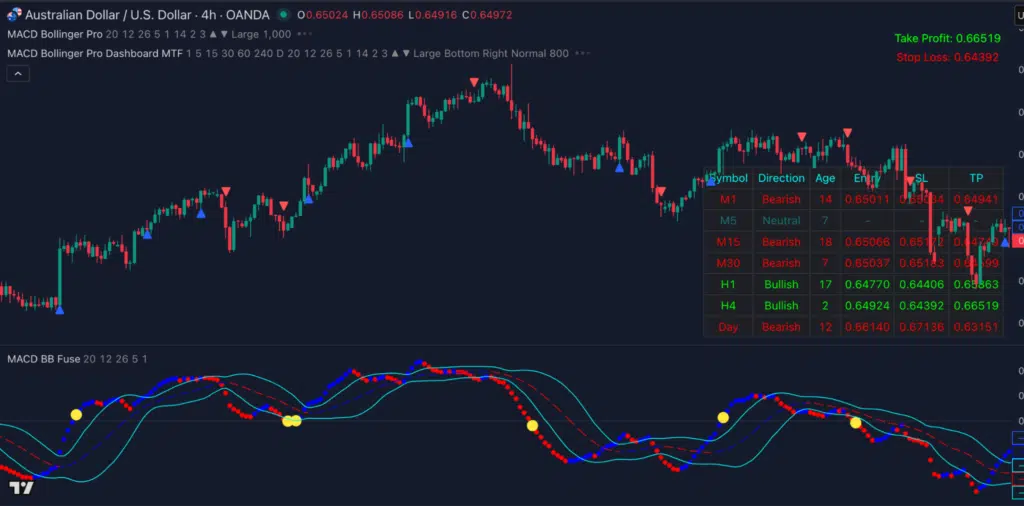
Instead of switching between volatility and momentum tools, traders now get trend direction and strength confirmed in one view. When the dot breaks above or below the bands, it signals early trend shifts backed by momentum, not noise.
Plus, its multi-timeframe dashboard lets you instantly see the trend across all timeframes, perfect for aligning trades with the dominant market direction.
5. Conclusion
The Bollinger Bands strategy alone can only tell part of the story.
But when you combine it with MACD, you unlock the full picture: direction, momentum, and volatility – all in one view.
If you’ve ever been frustrated by false breakouts or late signals, try blending both indicators, or better yet, experience the power of the MACD Bollinger PRO, a tool built to fix exactly those flaws.