In the right hands, Moving Averages can be a formidable tool, ready to shake up any market. You’re missing a lot if you aren’t using them for your trades!
Table of Contents
1. Introduction
In the right hands, Moving Averages can be a formidable tool, ready to shake up any market. The lines are so powerful that they’ve become the building blocks for several top indicators you recognize today.
Therefore, understanding them as this article aims will get you miles ahead of the trading crowd. You’ll discover their different forms and how to make the most of them.
2. Moving Average Explained
You’ve probably heard of the Moving Average (MA) regardless of your skill level or preferred discipline. It’s as old as trading itself and has found its place in almost every technical analyst’s toolkit.
Unfortunately, not everyone cares so much about its basics.
The MA is a statistical indicator that seeks to smoothen price fluctuations over a particular period. It achieves this by calculating the average of a series of values in a fixed subset size. This average is continuously recalculated as the market provides new (price) data points.
Therefore, the line is always “moving” with price during active trading hours.
In the charts, the Moving Average looks like a simple line shown below:
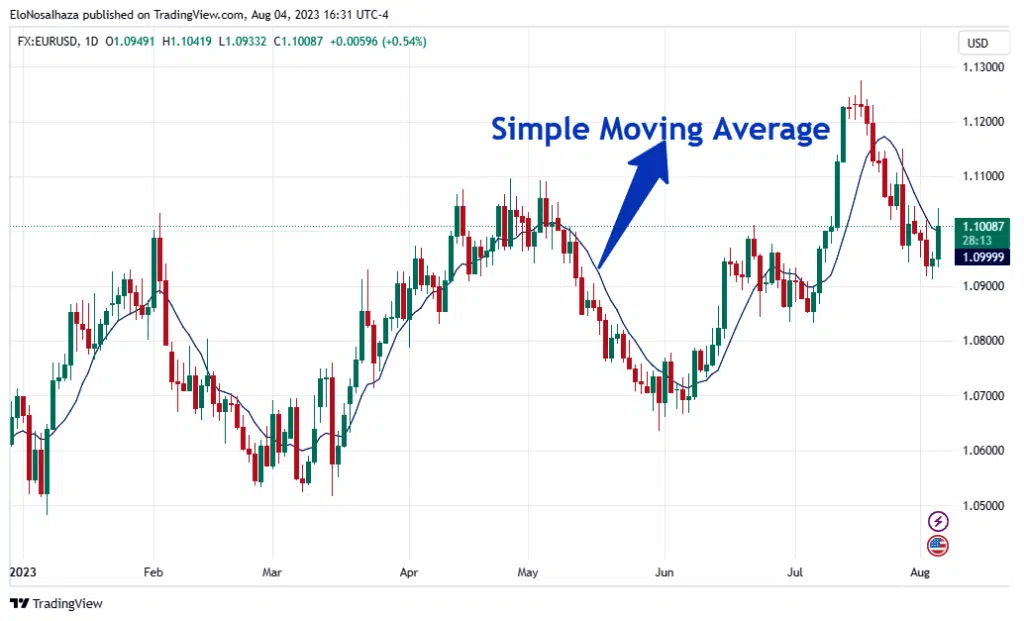
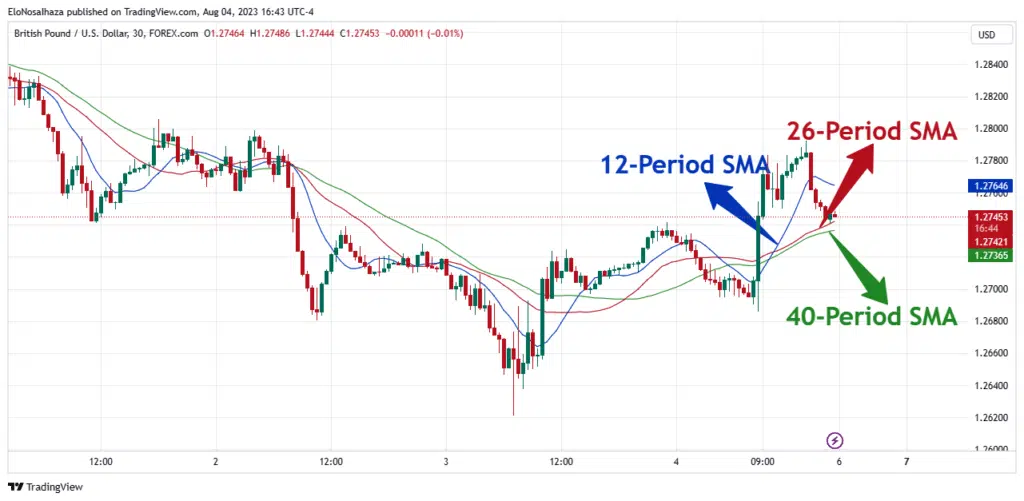
However, if the math behind it intrigues you, understanding the concept of ‘period’ becomes essential. It is the number of data points/time intervals (discussed earlier) for the average estimation.
For example, a 12-period moving average on a daily chart means the average calculation is from the last 12 days. Shorter periods are more sensitive to price movements than longer ones, which are smoother.
3. Types of Moving Averages
Moving Averages have become so popular that number enthusiasts have adapted them into various kinds. However, here are the three most popular options today:
- Simple Moving Average (SMA): This is the kind of Moving Average explained above. It is the most basic type, which sums up a set of data points and divides it by their count.
- Exponential Moving Average (EMA): With the same period, the EMA is more responsive to new price changes than the SMA because it gives more weight to the most recent data points when calculating the average.
- Weighted Moving Average (WMA): The WMA assigns different weights to each data point, whether recent or distant, depending on your trading plan.
4. How To Use the Moving Average
Like every indicator, the MA is a calculation of some price data. Traders use it in several ways, like its cross with candlesticks for buy and sell signals.
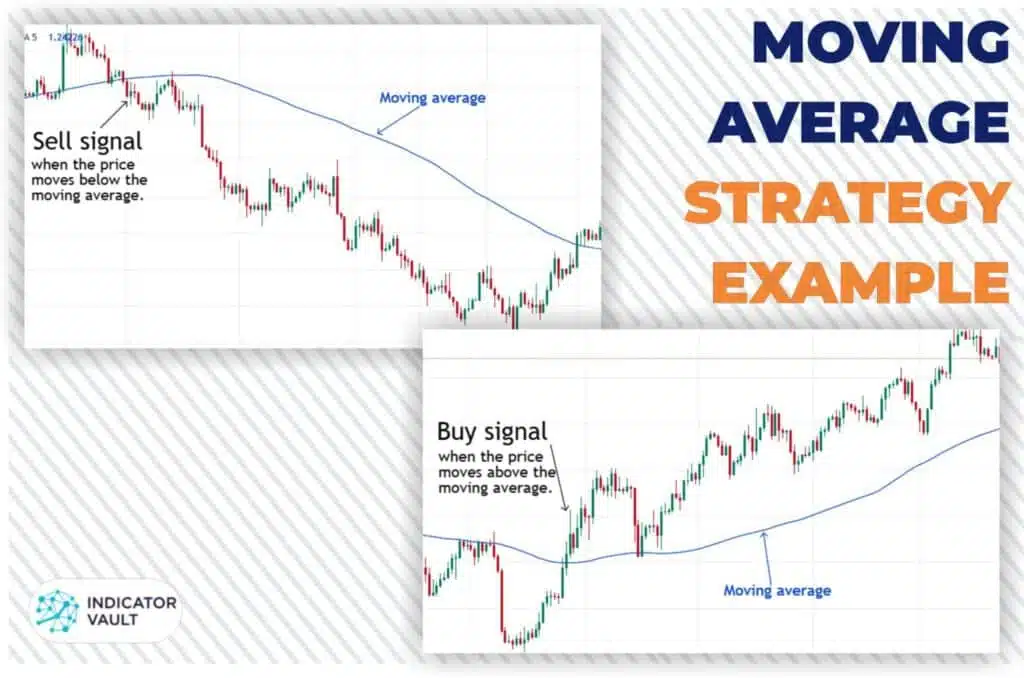
By combining two or more (of different periods), a cross between them can also trigger trade entries and exits.
That said, it can get much more complex, forming the key components of other indicators.
An example is the MACD, which needs the 12-period and 26-period EMAs to function. Their subtraction produces the MACD Line that eventually forms the Signal Line.
Thus, you’re actually relying on the Moving Average more than you might have thought.
Bollinger Bands and the Ichimoku Cloud are more indicators that use the Moving Average. However, none of them comes close to Dynamic Bands Indicator for TradingView.
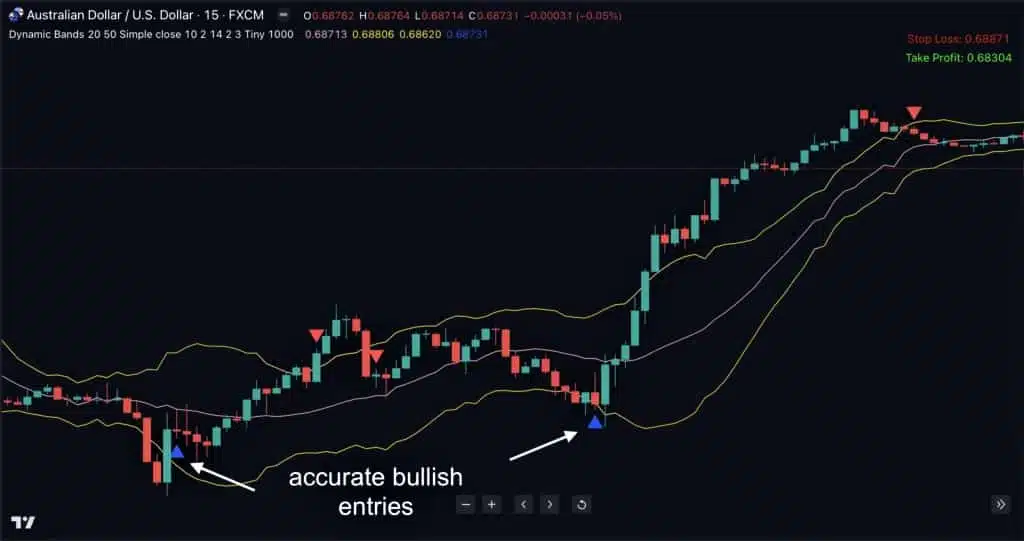
Indicator Vault brilliantly combined its Dynamic Moving Average and the Average True Range (ATR) for these Bands. The triggers pop up when price exceeds the upper/lower boundary and then crosses below/above the boundary again.
Here’s how it can make a real difference for you:
- You’ll get the most accurate prediction of bullish or bearish price breakouts.
- The lessened whipsaws of SMAs and Bollinger Bands reduces confusion.
- Traders can use it on multiple timeframes, from scalping to swing trading intervals.
- Every signal sends an instant alert within and outside TradingView, waiting for your execution. You’ll see the distinct arrows appear on the charts.
No other technical tool employs Moving Averages better than the Dynamic Bands Indicator. Luckily, it’s just within your reach by clicking here now.
5. Summary
The Moving Average is one of the most basic indicators in technical trading. However, its applications and strategies can’t be exaggerated.
Combined with more statistics, the MA forms the MACD, Ichimoku, and Bollinger Bands indicators, among many others. Yet, its most impressive product is Dynamic Bands Indicator for TradingView, which you can access today.
Don’t forget to share your views, questions, and trading results in the comment section below. Also, feel free to promote this article on social media, forums, and other blogs to assist more aspiring and expert traders.

