Mastering the identification and application of the bull flag pattern is crucial for enhancing your trading skills. Recognizing this pattern enables you to discern a continuation of favorable price movements, thereby yielding substantial profits.
Nevertheless, the advantages of patterns such as bull flags transcend mere profit-making. They can provide you with a comprehensive comprehension of the market’s workings. This article will guide you through comprehending the bull flag pattern, its identification, and trading strategies. Let’s dive in!
Table of Contents
1. What is A Bull Flag Pattern?
A bull flag is a widely recognized chart pattern utilized in technical analysis and trading to identify a bullish continuation. This pattern occurs when a stock or security trades in a sideways range subsequent to an advance, then breaks out above the resistance level, thus creating a strong uptrend.
To put it simply, the bull flag pattern implies that despite a potential temporary setback, a positive price trend is highly probable to continue.
The bear flag is the antithesis of the bullish flag pattern. While the latter signifies the continuation of favorable price movements, the bear flag pattern warns of an imminent downtrend. Bear flags share the same structure as bull flags- the flagpole and the flag itself- but are inverted. To learn more about bear flags, refer to this article: Bull Flag Vs Bear Flag| The Secret To Successful Trading In 3 Simple Steps
2. How to Identify Bull Flag Patterns
Identifying a bullish flag pattern begins with acknowledging an upward trend, known as the flagpole.
For the pattern to be classified as a bullish flag, a consolidation phase called the flag must follow the flagpole. The flag typically consists of minor price movements with progressively lower highs.
Once the consolidation phase ends, traders keep an eye out for a price breakout beyond the preceding highs. Such a breakout signifies a continuation of the bullish trend, providing a green light for traders to enter long positions.

While identifying flag chart patterns may appear straightforward, it is actually quite challenging. To avoid misinterpretation, it is crucial to pay close attention to all signals and wait for confirmation of the bullish trend before making any trading decisions, especially if you are not an experienced trader.
2.1. Example:
Here’s an example of a simple bull flag chart continuation pattern.

The provided image is a segment of the BTCUSD price chart from August 2021, displaying a distinct flagpole, a flag, and a subsequent uptrend. Despite a momentary dip, the price resumed its ascent, successfully completing the bull flag pattern.
2.2. Bull Flag vs Flat Top Breakout
A common query among traders is whether the bull flag pattern is identical to the flat top breakout. The answer to this question is no, as both patterns, though indicating a bullish continuation, differ significantly. The fundamental contrast between them is that the bull flag has lower consolidation whereas the flat top breakout entails a period of horizontal consolidation.
3. How to Trade a Bull Flag Chart Pattern
Having covered the nature of the bull flag pattern and techniques for identifying it, let’s discuss how to trade it. Two primary methods exist for trading the bull flag pattern: buying the breakout or buying the pullback.
Buying the breakout involves entering long positions when the price surpasses the resistance level. A stop-loss order should be placed beneath the consolidation level to prevent losses from a false breakout.
Buying the pullback entails entering long positions when the price retracts and tests the preceding highs. A stop-loss order should be placed beneath the pullback lows to safeguard against further decline.
Here are some additional tips for trading bull flag patterns:
- It is vital to wait for a definite breakout before executing a trade, as a false breakout can result in losses.
- Place a stop-loss order beneath the consolidation level or the pullback lows to minimize losses.
- Take profits when the price reaches the measured move target. The measured move target is the minimum price objective for the pattern, and it can be calculated by adding the flagpole height to the breakout point.
4. Pros and Cons of Bull Flag Patterns
Like all chart patterns, the bull flag has its pros and cons.
Pros:
- The bull flag pattern can signal the continuation of an uptrend, providing traders with a potential opportunity to earn profits.
- It offers clear price targets, facilitating the calculation of risk-reward ratios.
- The pattern is readily identifiable, making it easier for traders to spot.
Cons:
- False breakouts can occur, leading to potential losses.
- The pattern necessitates patience to await a definite breakout, which can take time.
- To minimize the possibility of suffering losses from false breakouts, traders can use tools like trading indicators and be patient when waiting for a breakout.
In most scenarios, it is better to wait for distinct and recognizable signals rather than immediately investing in a continuation pattern. Although this might result in missed profit, it can help to mitigate the risk of losing your initial investment. Avoid succumbing to FOMO and conduct your research to maximize your profit potential while trading. Best of luck!
5. An almost-perfect tool to easily detect Bull/Beal Flag Pattern
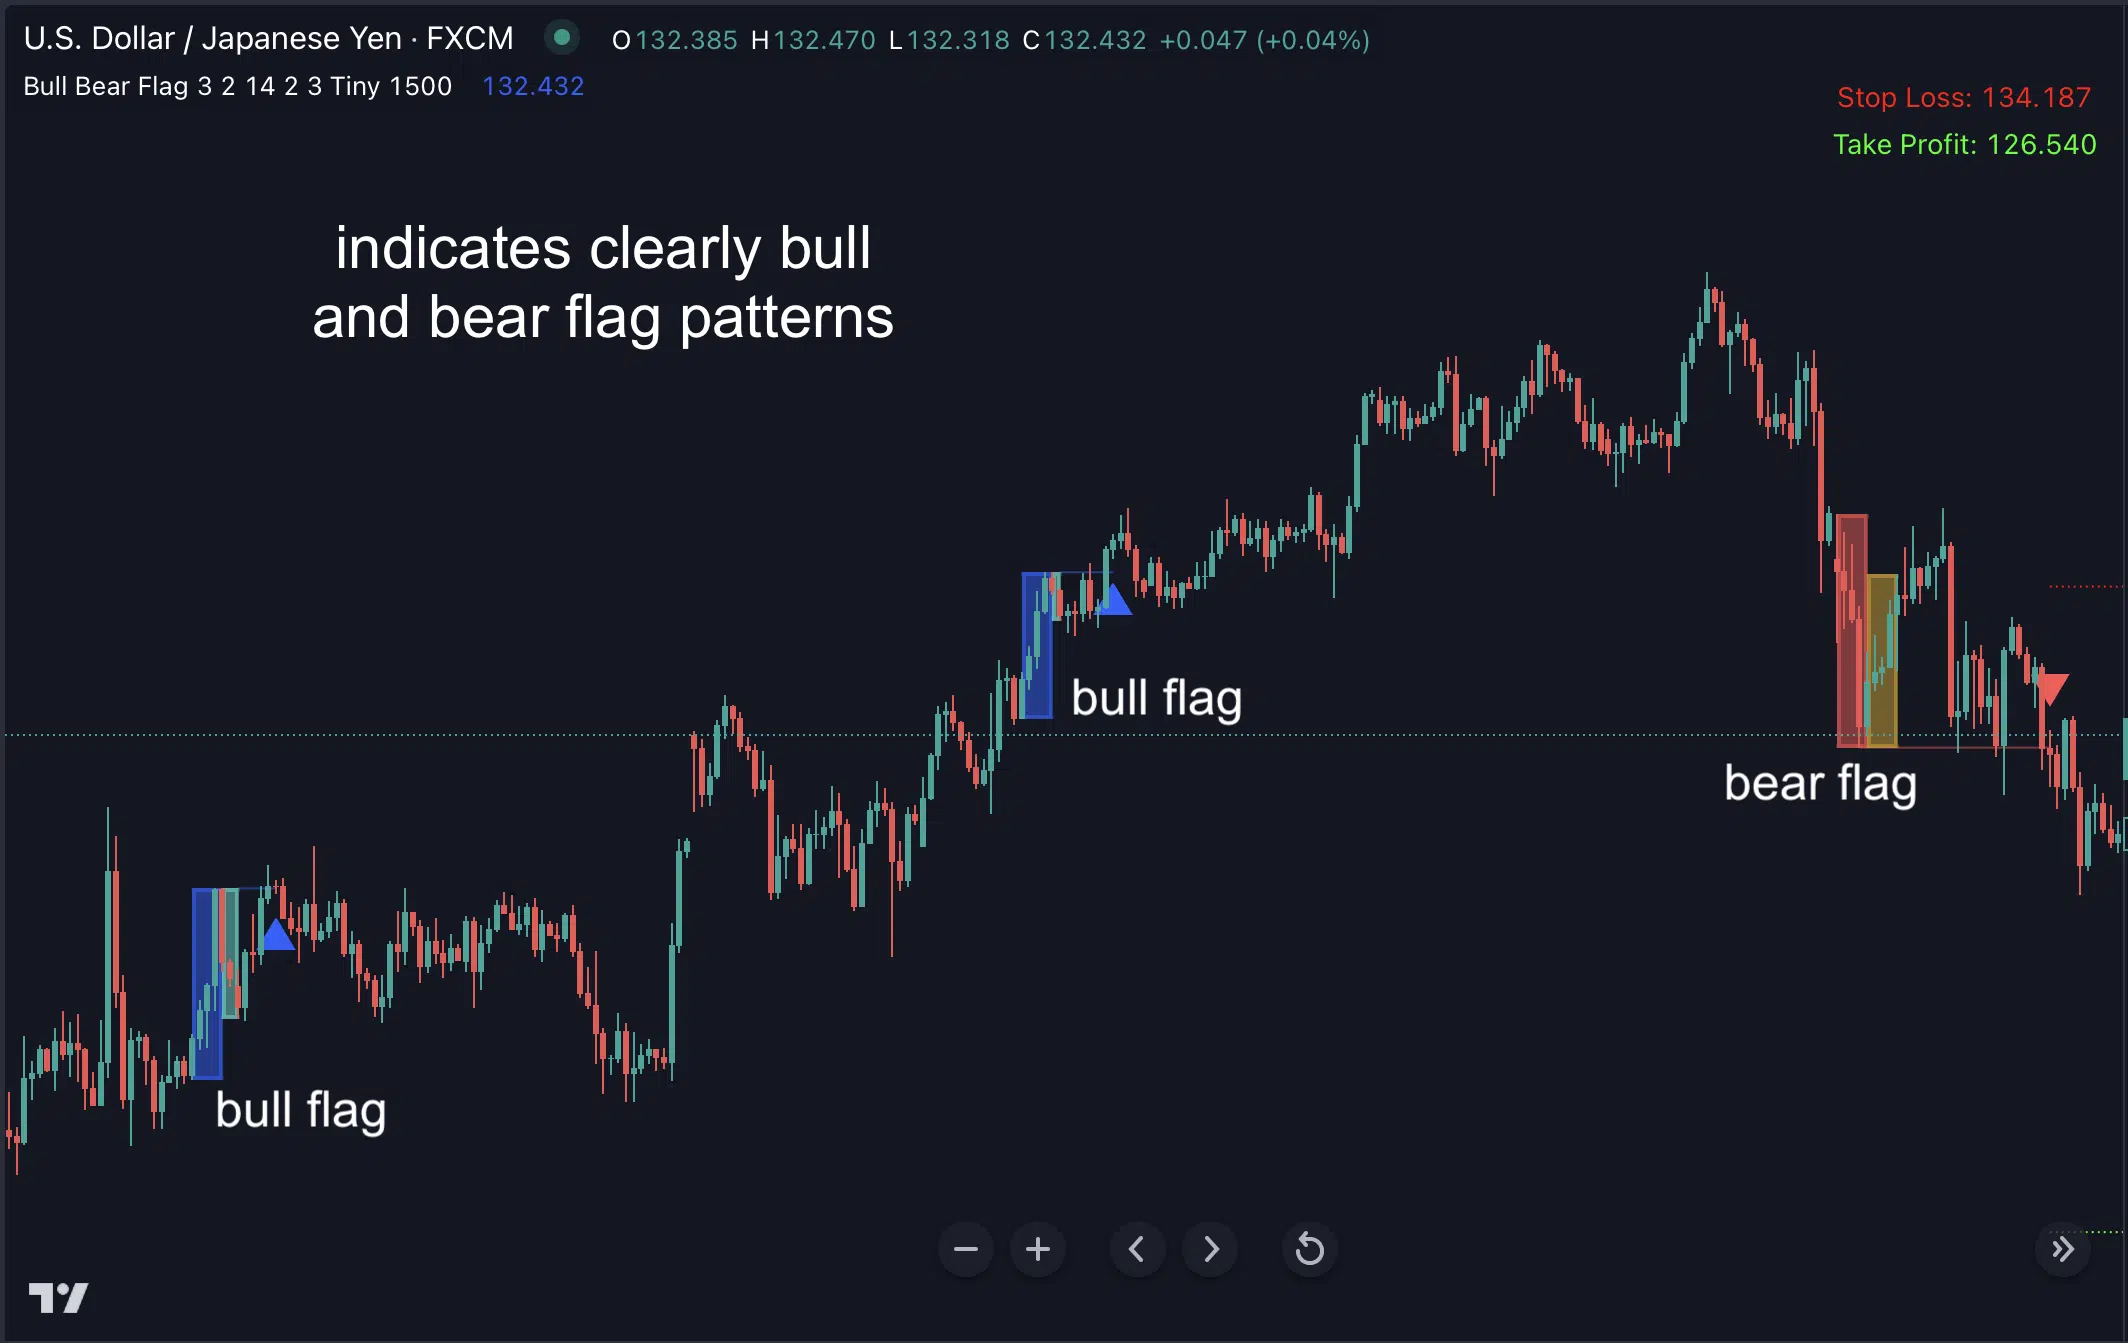
To make the “detecting bull and bear flags” job much simplier, you should check this out: Bull Bear Flag indicator for TradingView by Indicator Vault.
This indicator combines pattern recognition and momentum trading strategy, to confirm the strength of the trend, and identify great entries for breakout and trend trading.
Here’re some features:
- Accurate pattern detection
- High-probability entries
- Spot breakouts based on Bull Bear Flag patterns and give you precise entries with suggested SL/TP levels.
- Reduce false breakouts with additional confirmations
Interested? Click here to check out its all features
6. Final Thoughts
Bullish and bearish flags are significant continuation patterns that traders can utilize in the current market. They are relatively simple to identify and typically reliable. However, we advise dedicating considerable time to learning these patterns before attempting to use them with real funds, or pick a reliable tool like Bull Bear Flag indicator to make the work much easier.
In order to make the best decisions, it is important to equip yourself not only with fundamental knowledge but also with supportive tools that can serve as excellent guides.
What do you think? Please feel free to share your comments!
Find this article useful? Share this blog with your friends on social media!