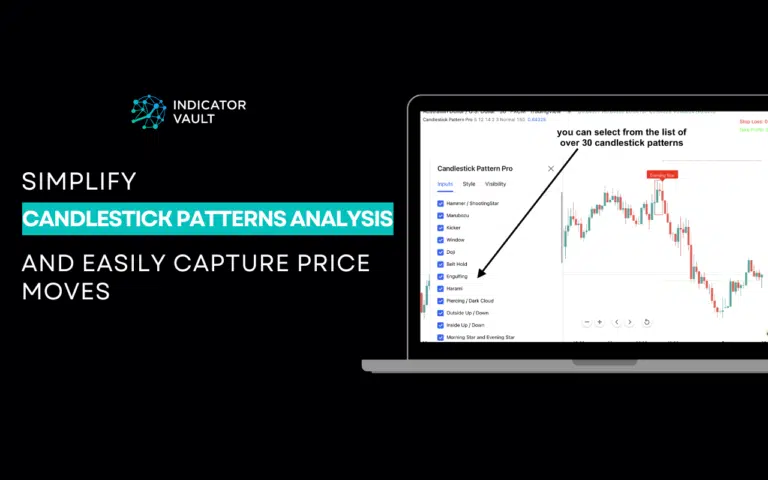
Video guide: Harmonic Pattern Pro for TradingView
|

Video guide: Harmonic Pattern Pro for TradingView

Table of Contents 1. Introducing the Harmonic Pattern Pro indicator for Tradingview ​ Want to make your harmonic pattern trading more effective? Many traders struggle with spotting these patterns and knowing when to pull the trigger. That’s where our brand-new Harmonic Pattern Pro indicator for Tradingview comes in. This powerful indicator automatically identifies key patterns,…

Enter the Realm of Advanced Trading: Complex Harmonic Patterns Made Effortless
|

Enter the Realm of Advanced Trading: Complex Harmonic Patterns Made Effortless

Manual harmonic pattern detection is slow and complex. Discover how Harmonic Pattern Pro automatically identifies key patterns, delivers precise entry points, and gives you real-time alerts for profitable trades. Table of Contents 1. The Harmonic Pattern is Too Complicated You’re probably already familiar with harmonic patterns—those advanced chart formations based on geometry and Fibonacci ratios….

Video Guide: Swing Force Indicator for Tradingview
|

Video Guide: Swing Force Indicator for Tradingview

Table of Contents 1. Introducing the Swing Force indicator for Tradingivew No stress. No doubt. Just certainty. Let the Swing Force indicator help you identify high-probability swing points. Wouldn’t it be great if… You could get better entry and exit points leading to higher profits? You could have accurate trend analysis to avoid bad trades?…

Swing Trading Strategy Secrets: How Smart Traders Spot Explosive Moves
|

Swing Trading Strategy Secrets: How Smart Traders Spot Explosive Moves

Table of Contents 1. What is swing trading strategy? Swing trading Swing trading is a trading style that captures short- to medium-term price movements over days or weeks. It balances between day trading’s intensity and long-term investing’s patience, allowing traders to profit from market swings without constant screen-watching. Swing trading strategy A swing trading strategy…

Video guide: A-RSI indicator for TradingView
|

Video guide: A-RSI indicator for TradingView

If you’ve been relying on the classic RSI, you probably know its strengths – but also its limitations. It’s a widely used momentum oscillator, but it often lags behind real market movements, leaving traders struggling to time their entries and exits effectively. Have you ever… Entered a trade based on an overbought/oversold RSI signal, only…

RSI vs. A-RSI: The Smarter Way to Identify Trend Reversals

RSI vs. A-RSI: The Smarter Way to Identify Trend Reversals

Struggling with RSI’s lagging signals? The A-RSI Indicator eliminates delays, spots pullback entries, and detects bullish & bearish divergences with precision. Table of Contents 1. How hard does RSI identify the great-timing price change direction? The traditional RSI (Relative Strength Index) can struggle to accurately identify great-timing price direction changes due to its nature as…

Video Guide: Bull Bear Flag Indicator for Tradingview

Video Guide: Bull Bear Flag Indicator for Tradingview

Table of Contents 1. Introducing the Bull Bear Flag indicator for Tradingview Follow the trend. Spot the breakouts. Ride the momentum. Let Bull Bear Flag indicator does the heavy lifting for you: Instantly identifies bull and bear flag patterns on your chart, ensuring you never miss a potential breakout or trend continuation. Validates patterns with…

Catch Explosive Breakouts – Bull Bear Flag 101 Guide
|

Catch Explosive Breakouts – Bull Bear Flag 101 Guide

Table of Contents 1. Day Trading Frustrations? Missed Breakouts? It’s Not You, It’s the Signals. Admit it. You love the thrill of catching those explosive breakouts. The sudden surge in price, the potential for quick profits – it’s an adrenaline rush like no other. But let’s face it, missing those key moves? Watching a promising…

How to Use 30+ Candlestick Patterns to Spot Profitable Trade Setups
|

How to Use 30+ Candlestick Patterns to Spot Profitable Trade Setups

Table of Contents 1. What Is A Candlestick Pattern? A candlestick pattern is a visual representation of price movements over a specific period, helping traders understand market sentiment. Each candlestick contains four key pieces of information: open, close, high, and low prices within a given timeframe. Traders use these patterns to predict future price movements,…

Explosive Insights: Exploiting the Power of Trading Volume and Breakout Strategies
|

Explosive Insights: Exploiting the Power of Trading Volume and Breakout Strategies

Table of Contents 1. Introduction Analysts of all experience levels champion the trading volume as a highly reliable and objective data source. Among several notable strategies it supplements is the breakout theory. How does the combo work exactly? This concise blog post discusses the fundamentals and applications of the trading volume to secure success. As…