Table of Contents
1. Introduction
In day trading strategy, trading on low time frames (like the 1-minute, 5-minute, or 15-minute charts) is often called scalping or day trading. It’s fast-paced and offers great potential for quick profits.
However, success here isn’t luck, it requires a clear, well-timed strategy. This guide breaks down the most reliable ways to get in and out of the market successfully.
This article shares practical pointers on how to enter and exit short-term trades profitably. Traders will also gain access to a revolutionary technical tool that instantly skyrockets one’s results.
2. Trade Entry Strategies
A profitable low time frame trade almost always starts with a perfect entry. Here are the most reliable ways to open your position:
2.1. The Pullback Entry in day trading strategy
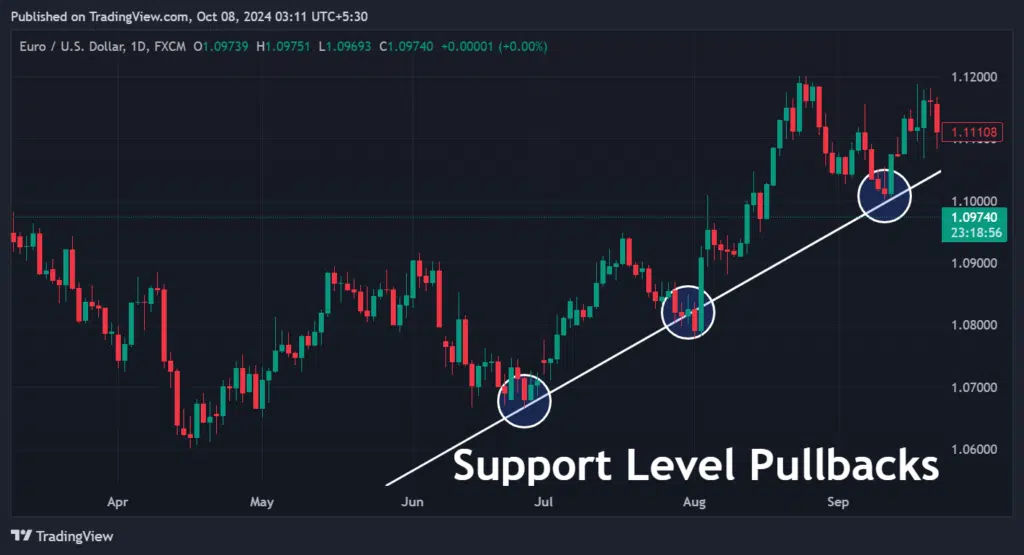
When a new trend begins, the price often moves forward, stops briefly to take a breath (this is called a “pullback”), and then continues moving in the original direction.
- Your Opportunity: The pullback, the temporary dip back to an important price level, is your chance to enter the new trend at a better price.
- Double Pullback: Sometimes the price “pulls back” twice, giving you a second, even stronger confirmation before the trend truly takes off
Several inventive analysts have coined multiple approaches from extensive market studies for this.
However, below are a few of the most reliable options to trigger potentially successful trades.
2.2. The Breakout Entry in day trading strategy

Technical traders watch key price levels where the market has previously stopped or reversed (Support and Resistance).
- The Signal: A breakout happens when the price pushes past one of these major levels. This proves the market has strong momentum and is ready to start a fast move.
- Your Entry: You enter the trade as soon as the price clearly moves beyond that important level, riding the confirmed momentum.
2.3. Indicator Momentum Entry
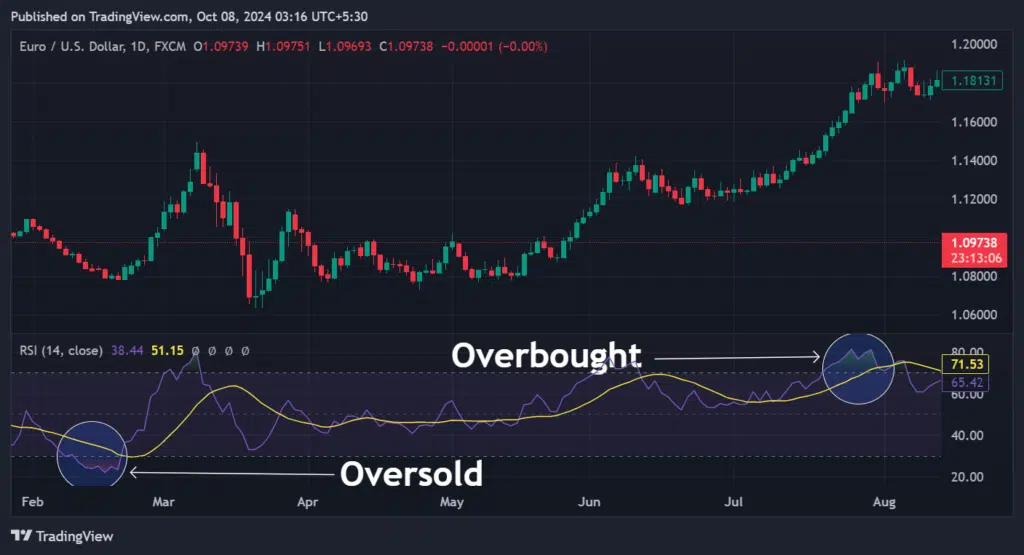
Many traders use momentum indicators like the Relative Strength Index (RSI) or MACD to confirm when a trend is about to start.
- The Warning: These tools identify “overbought” (price is too high) or “oversold” (price is too low) conditions.
- The Action: When the market hits one of these extreme levels, it’s highly likely to reverse and start a new trend in the opposite direction. This reversal is your entry confirmation
A break beyond these levels is typically sufficient for trade entries because it proves increased market momentum.
Simultaneously, the trading volume may also increase for further confirmation.
2.4. Golden Rule Tip: Confirming the Higher Time Frame Trend
The HTF Check: Before taking any low time frame entry, always check the next higher time frame (e.g., if trading 5-min, check the 1-hour). Only trade in the direction of the established trend on the higher chart.
Avoid Noise: Trading against the higher time frame trend increases your risk significantly and reduces the probability of a successful low time frame trade
3. Trade Exit Strategies
Knowing when to close a position is just as important as knowing when to enter. Here’s how experts secure their profits and avoid losses:
3.1. Reversal Candlestick and Chart Patterns
Once a trend is running, always be on the lookout for patterns that signal its end.

Candlestick Patterns: Look for shapes like Engulfing Candles (a large candle swallowing the previous one), Dojis (indecision), or Shooting Stars (rejection at the high). These formations are often a warning sign that the current trend is about to turn around.
Chart Patterns: Larger shapes like Head and Shoulders (signaling a top), Double Tops/Bottoms, or a Rising/Falling Wedge also strongly suggest the trend is over. You should exit immediately to lock in your profits before the major reversal hits.
3.2 Momentum Indicator Signals
Just as you use indicators to enter, you can use them to exit.
- The Exit Signal: When your momentum indicator (like RSI) moves out of the middle zone and hits the overbought or oversold extreme, it signals that the current move is running out of steam.
- Your Action: This is your alert to close your active trade and protect the profit you’ve made, even before the price fully reverses.
3.3 Trailing Stop and Take Profit Orders

These tools manage risk and profit for you automatically, reducing emotional interference.
- Take-Profit (TP): This is a fixed order you place to automatically sell the asset when it hits a target price. Traders often set TPs at major Fibonacci extension levels or at a specific Risk-to-Reward ratio (e.g., 1:2 or 1:3) relative to their initial stop loss. It secures your profit immediately.
- Trailing Stop: This is a smarter Stop-Loss. It moves automatically to protect your gains as the price moves favorably. It locks in profit and allows you to catch extended runs. If the price suddenly reverses, the stop-loss stays put and closes the trade, allowing you to maximize gains right up until the trend ends without manual intervention.
3.4. Golden Rule Tip: Managing Risk-to-Reward (R:R)
Non-Negotiable: Never enter a trade unless your potential Take Profit (TP) target is at least twice the distance of your Stop Loss (SL)—a minimum 1:2 Risk-to-Reward ratio.
Scalping R:R: Even in fast low time frame trades, ensure you secure profits that are disproportionately larger than the risk taken. This is essential for long-term profitability, even with a moderate win rate.
4. Unlocking the Secrets of Day Trading Strategy With a Groundbreaking Invention
Market reversal points are the best positions to enter new trades even in lower timeframes. Traders get the opportunity to ride most of a potential trend, resulting in maximum profits.
However, discovering them is highly challenging for many reasons.
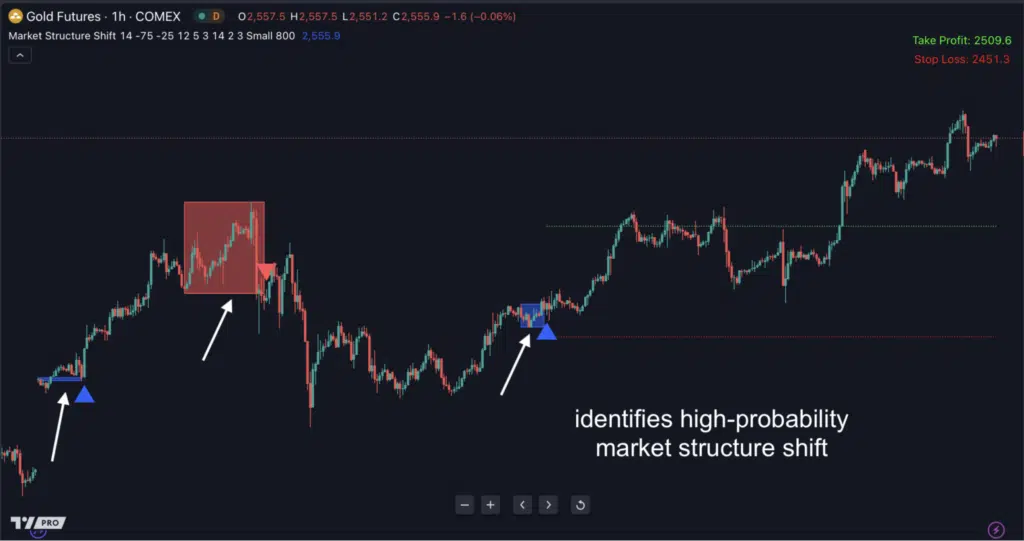
Indicator Vault’s Market Structure Shift for TradingView is the most powerful solution, based on track record.
It pinpoints these positions effortlessly, further refined with a Williams %R Momentum.
Moreover, it suggests the best stop loss and take-profit levels for any active position – indispensable for traders seeking perfect trade exits.
The following are unbeatable benefits the technical tool offers every user:
- Earliest awareness of a market shift and potential reversal
- Confidence in taking every suggested trade opportunity due to its double-confirmation feature
- Ability to enjoy semi-automated trading due to the risk management levels suggestions
- Liberty to trade in any financial market across all time frames
- Assurance of exploiting any promising opportunity, credit to TradingView’s reliable alert system
Sounds like a dream come true? Click here now to discover more about this game-changing trading system.
5. Final Thoughts
Every profitable action in the financial markets depends on correctly timed trade entries and exits.
Pullback, breakout, and indicator-signaled momentum theories (discussed in this article) are highly recommended for entries. Technical analysis patterns and trailing stop-losses are some of the best exit strategies.
Fortunately, the Market Structure Shift for TradingView streamlines the entire process significantly with its double-confirmation algorithm.
Feel free to share your results, theories, or observations in the Comments Section below.
Also, please pass this content on to friends and colleagues in every trading circle.