Choosing the right day trading time frames strategies is the single most important decision for a new investor. It dictates your daily schedule, your risk exposure, and your overall strategy. Whether you are a fast-paced scalper or a long-term investor, understanding how to navigate different chart intervals is the key to market consistency.
Table of Contents
1. Defining the Best Day Trading Time frames Strategies for Your Style
Every day trading time frames strategies offer a different perspective on price action. Generally, the longer the timeframe, the more reliable the signals. Shorter timeframes offer more opportunities but come with increased “market noise.” Before we move to the details, we need to know all the basic.
Popular Trading Styles and Their Intervals:
- Scalping (1m – 5m): Best for high-energy traders looking for small, rapid profits.
- Day Trading (15m – 1h): The ideal trading timeframe for those who want to open and close positions within a single day.
- Swing Trading (4h – Daily): Perfect for busy professionals; you hold trades for days or weeks.
- Position Trading (Weekly – Monthly): Focuses on long-term macro trends and fundamental value.
1.1 What is Multi-Timeframe Analysis?
MTFA is the process of viewing the same asset across different time scales (e.g., Daily, 4-Hour, and 15-Minute).
- The Microscope (Lower Timeframes): Shows the noise and precise entry points.
- The Map (Higher Timeframes): Shows the “Main Street” trend and institutional zones.
By combining these, you achieve confluence, the point where multiple charts agree on a direction, significantly increasing your win rate.
1.2. The Long-Term Timeframe (The Trend Map)
Goal: To determine the “Market Tide.” When you look at your longest chart, you aren’t looking for a place to buy or sell yet. You are looking for the dominant direction. If the candles are making “stairs” going up (higher highs and higher lows), the trend is bullish. If they are stepping down, it’s bearish.
Action: If the long-term trend is Up, you are forbidden from selling. You are only looking for a reason to buy. This keeps you on the same side as the “big money” (banks and institutions).
1.3. The Medium-Term Timeframe (The Setup Zone)
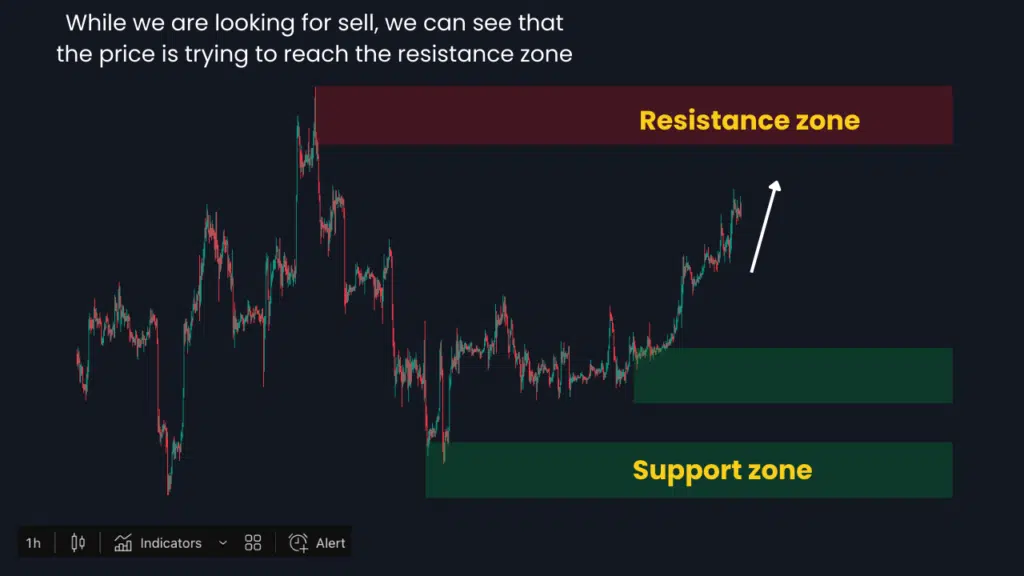
Goal: To find “Fair Value” and areas of interest. Now that you know the direction, you look at the middle chart to see where the price is likely to pause or bounce. You are looking for Support and Resistance levels or “Supply and Demand” zones.
Action: You wait for the price to pull back into a key level that matches your long-term trend. Think of this as the “waiting room.” You don’t take the trade just because it hit the zone; you simply get ready.
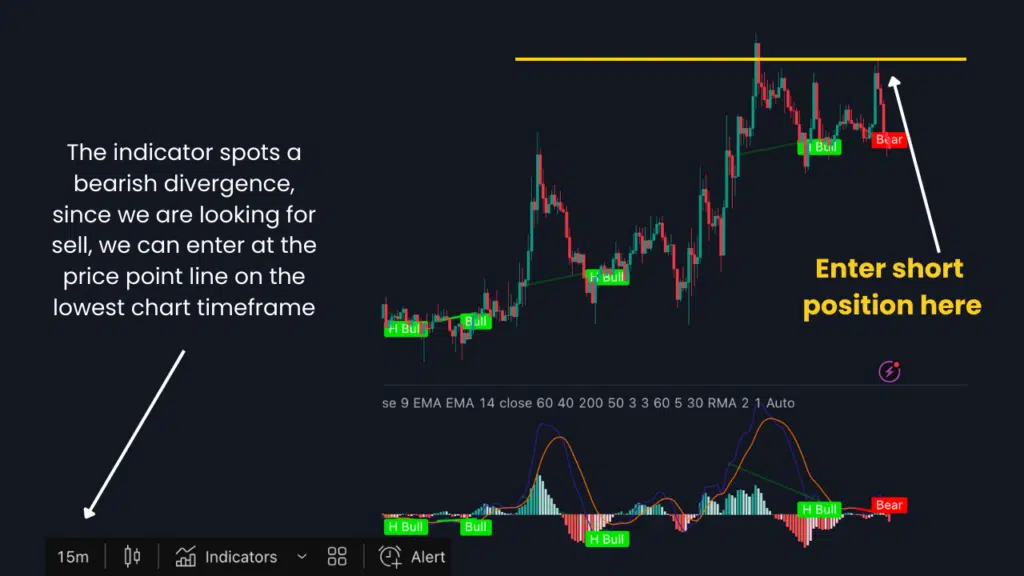
1.4 The Short-Term Timeframe (The Execution Trigger)
Goal: To find the “Micro-Entry” with low risk. This is where you zoom in to see the battle between buyers and sellers up close. Because this chart moves fast, you can see a reversal happening before it shows up on the bigger charts.
Action: Look for a specific “trigger” signal—like a bullish candle pattern or an indicator crossover—right as the price touches the zone you found on your medium chart. This allows you to have a very tight stop Loss, meaning if you are wrong, you lose a little, but if you are right, the profit potential is huge.
2. Choosing Your Timeframe Triad
Don’t get paralyzed by too many charts.
To keep it simple, use the Rule of 4 or 6. This means your big chart should be about 4 to 6 times larger than your small chart.
- Swing Traders: Use the Weekly chart for the trend, the Daily for the setup, and the 4-Hour for the entry.
- Day Traders: Use the 4-Hour chart for the trend, the 1-Hour for the setup, and the 15-Minute for the entry.
- Scalpers: Use the 1-Hour chart for the trend, the 15-Minute for the setup, and the 1-Minute for the entry.
3. The 3-Step "Top-Down" Day Trading time frames Strategy
To trade with MTFA effectively, you must follow a strict order of operations:
Step 1: Identify the Anchor Trend (Higher Timeframe)
Open your highest chart (e.g., Daily). Is the price making higher highs? If yes, you are only looking for buys. If it’s making lower lows, you only look for sells.
Various tools like the Moving Average can help with this confirmation on longer-term time frames.

Step 2: Locate Key Zones (Intermediate Timeframe)
Move to your middle chart. Draw your Support and Resistance levels here. You want to see the price “pulling back” into a key area of interest that aligns with your Step 1 trend.
Step 3: Precise Execution (Entry Timeframe)
Zoom in to your lowest chart. Wait for a candlestick confirmation (like a Pin Bar or Bullish Engulfing) or an indicator crossover inside your key zone. This is where you pull the trigger.
The magnified view ensures traders open and close positions favorably at the best time to ride the profit from the trend.
4. All Markets, All Time Frames: Your Command Center for Market Mastery
The no. 1 use of time frames for veteran traders is to approach the market holistically and align trades with the current trending conditions.
A mind-blowing invention, the 3MA Dashboard for TradingView, assures this with minimal effort.
The technical tool’s primary function is to scan 7+ markets and time frames for high-probability opportunities.
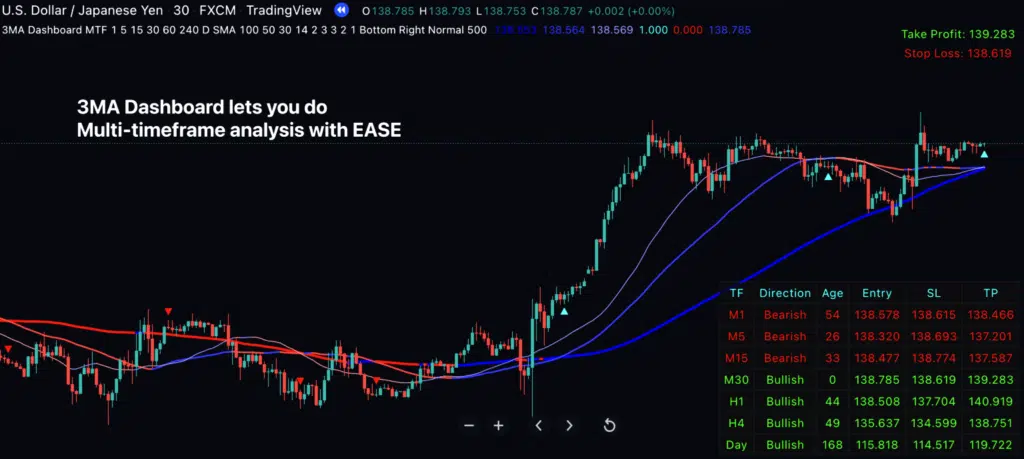
Concisely, here are the benefits every user obtains from its application:
- Improved awareness of the market conditions in one glance
- Ability to trade in any desired time frame or market
- Liberty to customize the tool in multiple ways
- Confidence in taking every opportunity due to the platform’s reliable alert system
Hard to believe? Discover these and many more perks to elevate your trading experience here now!
5. Conclusion
Nowadays, trading with multiple time frames is almost a prerequisite for success. Every expert does this in one way or another.
It typically involves identifying the long-term trend with higher time frames and improving trade entry & exit precisions with lower ones.
Newbies or intermediate-level traders can skyrocket their experience in this with the 3MA Dashboard for TradingView.
Please share this article with trading enthusiasts for increased awareness of analysis with multiple time frames and its benefits.
Also, leave a question or contribution in the engaging Comment Section below.