
Catching market reversals using the double top and double bottom pattern has always been a big flex among traders. Not only does it show precision in price analysis, but it also highlights patience and careful attention to detail.
Continue reading this article to learn how to skillfully trade the double top and double bottom pattern in charts, regardless of your experience level. It also discusses a few dos and don’ts while trading this classic reversal structure for the best results.
The double top and double bottom pattern has long been a buzzword in trading communities. However, rookie traders may need help to understand it well enough for meaningful discussions. What is this pattern exactly?
The double top and double bottom pattern represents structured reversal formations in price action. A double top pattern forms after a bullish move and signals potential bearish reversal, while a double bottom pattern forms after a bearish move and signals potential bullish reversal.
Provided price moves, double top and double bottom patterns will always be present in charts across all timeframes.
You can also think of the double top and double bottom pattern as a structured turning point. The double top pattern marks the transition from bullish to bearish conditions, while the double bottom pattern signals the opposite.
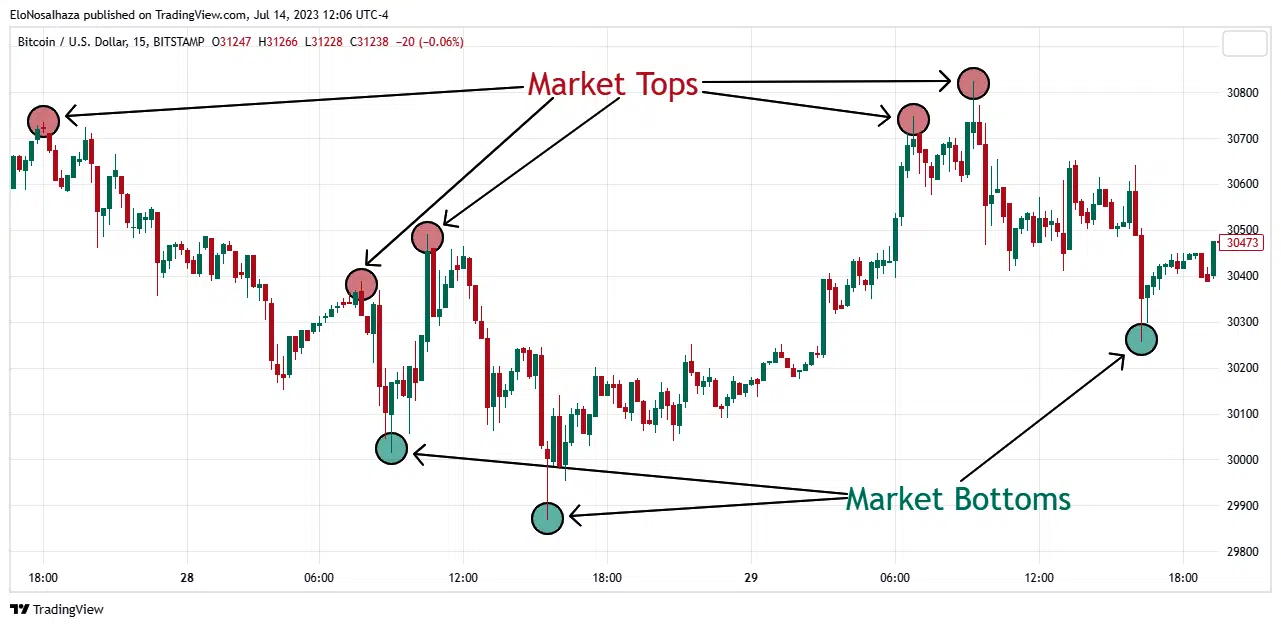
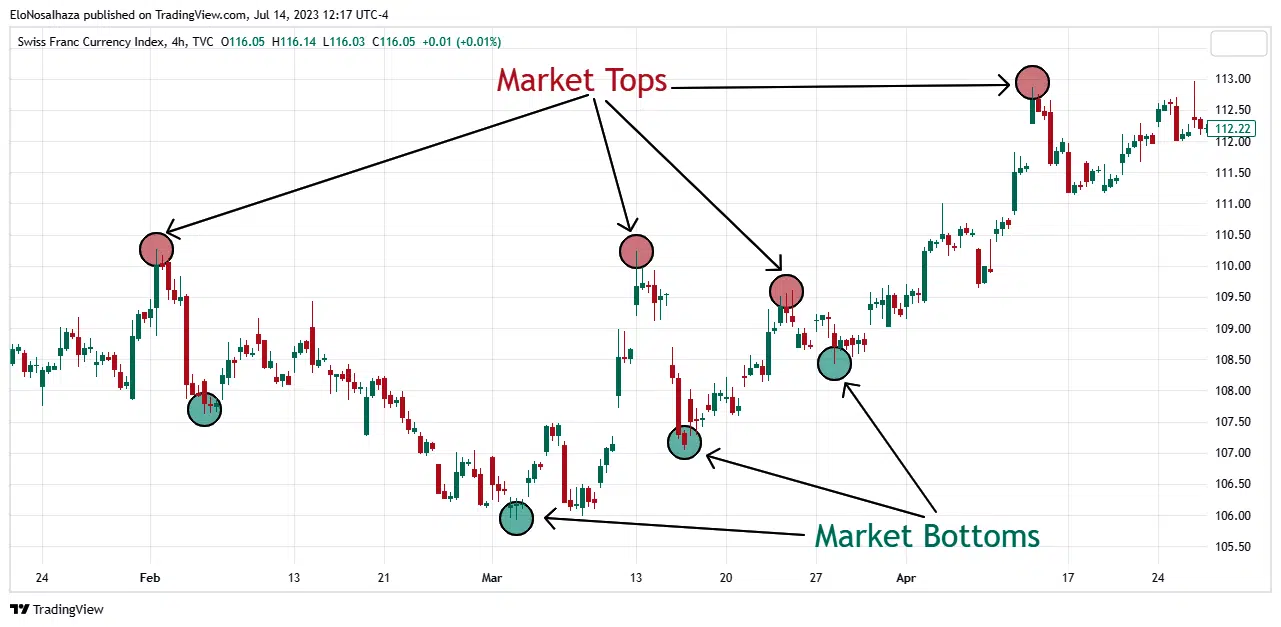
You’re not alone if you struggle to identify a double top and double bottom pattern in real time. Below are excellent examples across various asset classes on candlestick charts:
The E-Mini Futures formed two clear double bottom patterns on 14 and 15 June, respectively, before two double top patterns that began a sustained bearish market.
PS: Unlike the double bottom patterns, the second double top pattern broke slightly above the first before reversing.
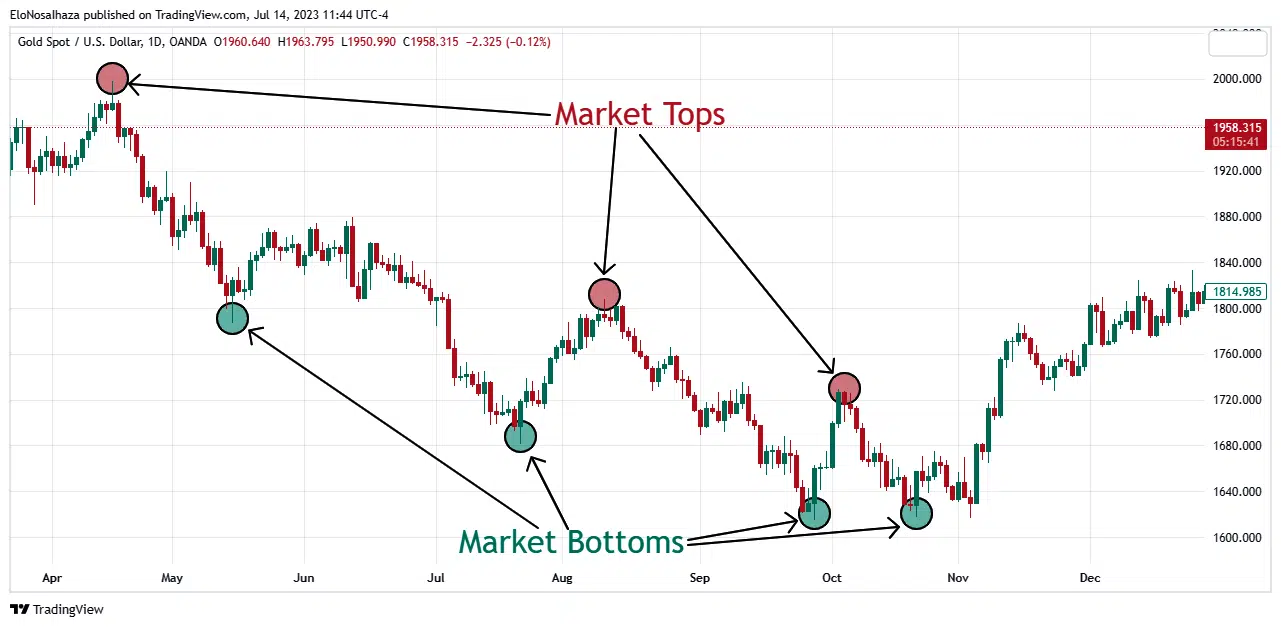
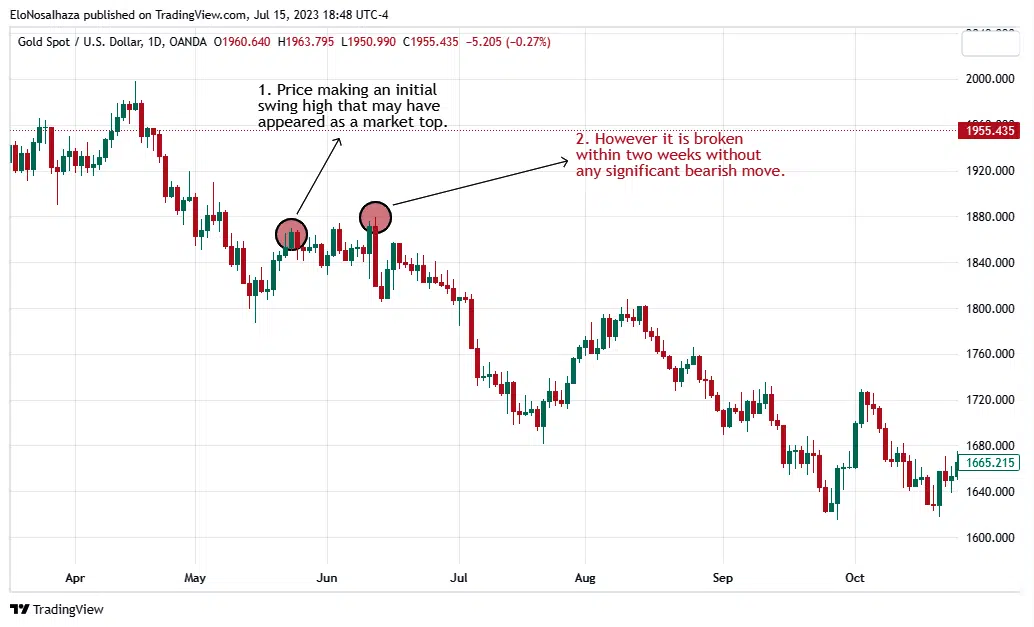
Despite being in a relative downtrend from April to November 2022, the Gold/US Dollar chart formed significant double bottom patterns that could’ve been exploited intra-day.
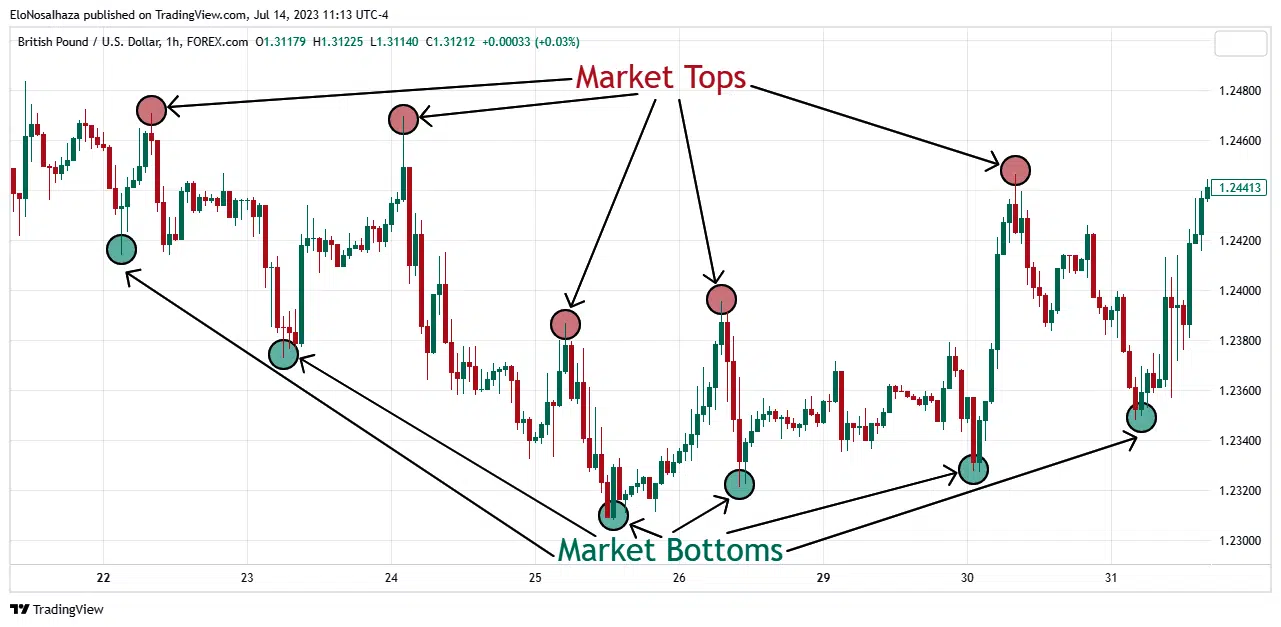
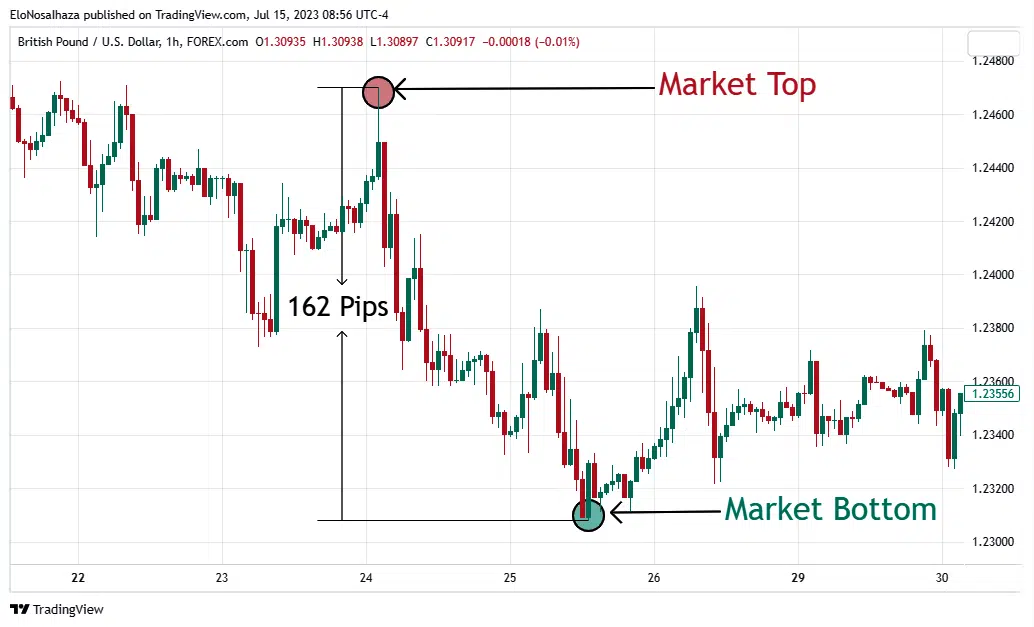
Between 21 May to 1 June 2022, the consolidation in the GBP/USD chart produced several double top and double bottom patterns.
Note that not every swing high or low is a market top or bottom, respectively. Ideally, there should be a prior opposing trend. Still, not all the cases eventually panned out.
Like other markets, crypto charts also display clear double top and double bottom patterns.
Trading the double top and double bottom pattern in instruments with chart gaps is more challenging. Hence, pros study them carefully during inter-market analysis.
There are several reasons behind such gaps, including less popularity and inactive trading.
In hindsight, double top and double bottom patterns seem easy to spot, especially if you’ve never forward-tested your strategy. Trading from them means earning the most (in pips) when the price moves in your direction.
However, identifying them in real-time is the real pain.
When can you be sure of market reversals? Are there any ideal conditions? What’s the best way to catch such tops and bottoms?
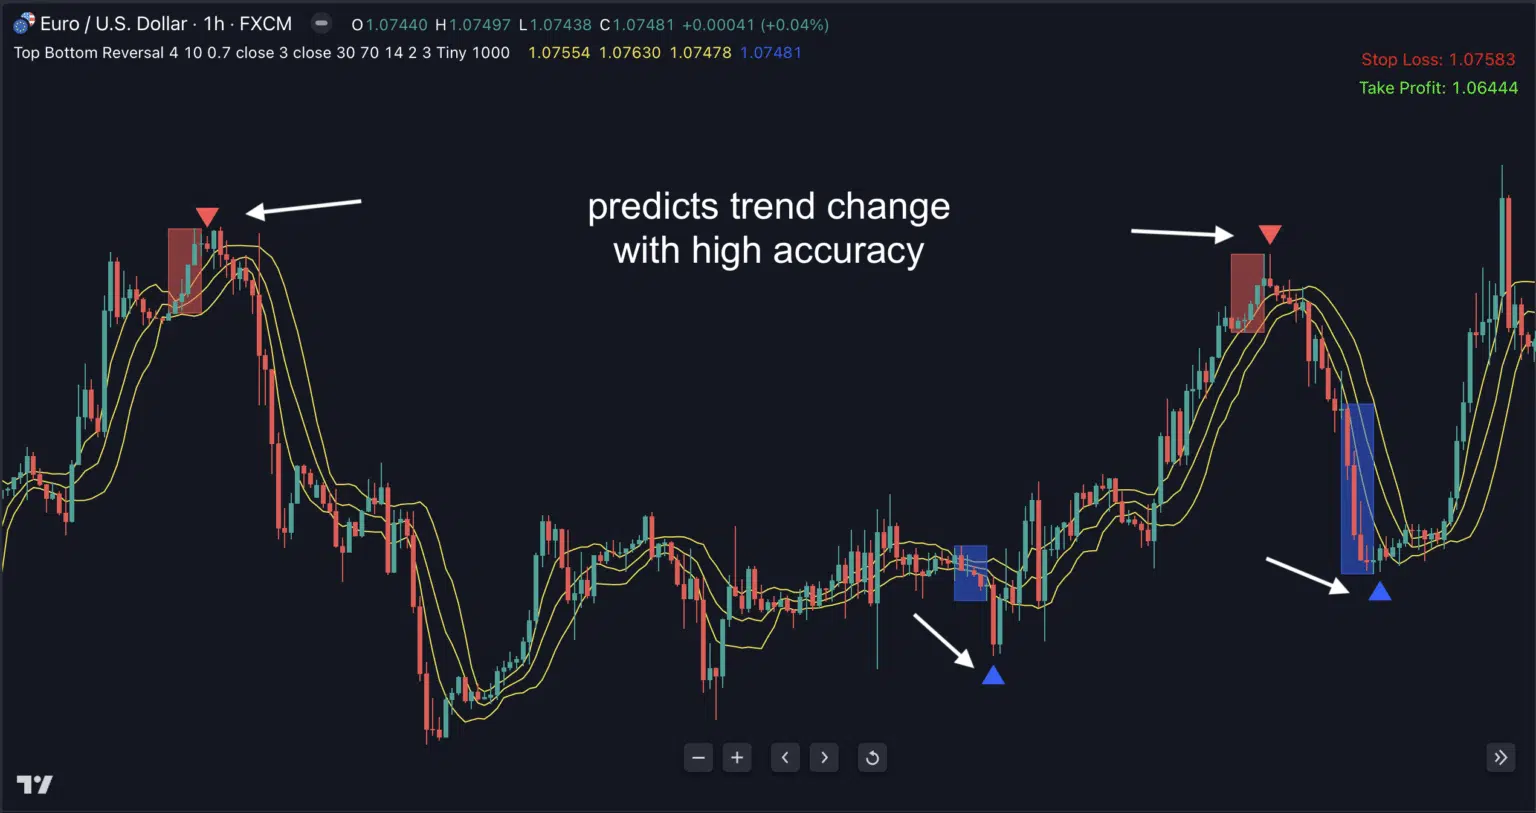
Using powerful indicators is hands-down the easiest way to trade the double top and double bottom pattern, and none does it better than the Top Bottom Reversal Indicator on TradingView.
The tool does this accurately by combining signals from three high-probability references, as follows:
With these confined in the indicator’s complex algorithms, traders nail almost every major top and bottom in the market without a fuss.
Whether you’re a beginner or a specialist, a scalper or swing trader, there’s hardly a better alternative than this.
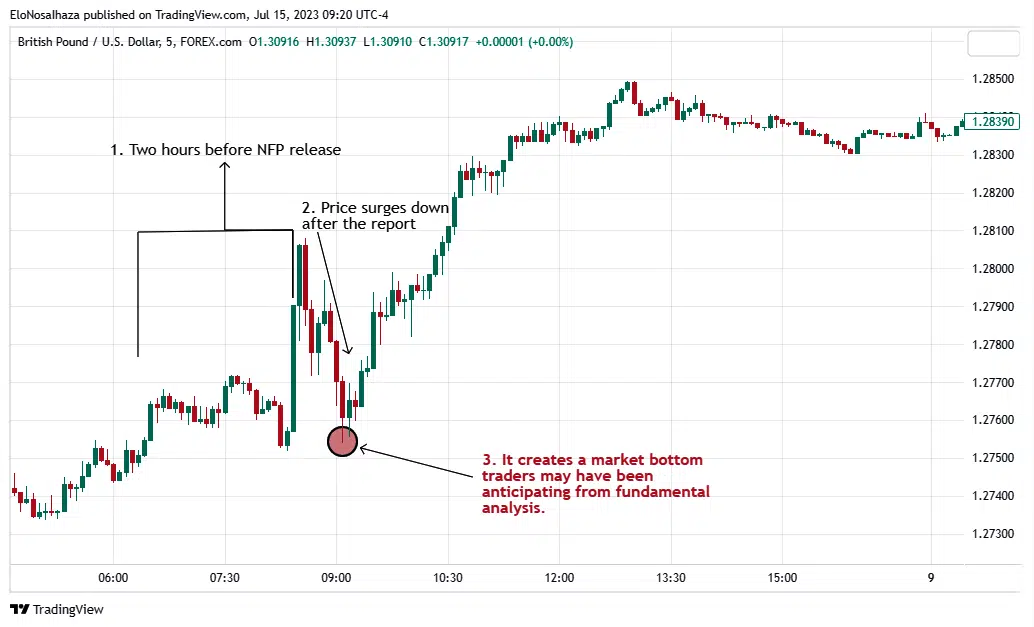
Fundamentalists also use news reports to forecast possible market tops and bottoms. Thus, it’s not as straightforward as the Top Bottom Reversal Indicator.
It basically involves analyzing an upcoming (usually high-impact) report to predict the price’s next likely move.
For example, major pairs in the currency market react dramatically to NFP releases. With other fundamental analysis tools, you can nail the high or the low before a strong reversal after the release.
Traders can blend it with technical concepts, such as candlestick patterns, for improved accuracy.
Other high-impact events include GDP releases, inflation (CPI) data, earnings reports, and monetary policy statements.
The Community of Traders (COT) report has always helped understand market sentiment. However, you can get more precise with it.
A market top will likely form on a currency index when the hedgers keep increasing their short positions while speculators continue adding more long positions.
Conversely, traders expect a market bottom if hedgers continue increasing their long positions while speculators keep adding more short ones.
The results can be mind-blowing after comparing the index chart to strongly linked markets in higher timeframes.
Babypips discussed this in more detail with illustrations.
Catching market tops and bottoms is always thrilling, no matter your trading discipline & strategy.
You’re entering and leaving potentially profitable trades at the earliest time possible. Thus, there are hardly any downsides if you can constantly do it perfectly.
That isn’t always the case, unfortunately, due to several manageable and unmanageable circumstances. Hence, below are essential considerations if you’re planning to hunt tops and bottoms:
Luckily, traders only have to wait for the triggers when using the Top Bottom Reversal Indicator. You’ll never miss opportunities through prompt pop-ups, emails, and push notifications within and outside TradingView.
However, any other strategy to catch tops and bottoms demands more patience and attention. You start brainstorming and drawing conclusions as every candle forms.
It can be exhausting and even frustrating to some, but the potential payoff when you get them makes it all worthwhile.
Just because the Top Bottom Reversal Indicator signals a new entry doesn’t mean you should throw all logic out the window. The markets can always make inexplicable moves, so stick to your risk management strategies for protection.
You can’t even be 100% sure you picked the topmost top or bottom-most bottom before a significant price run until later.
Calculate the ideal position size; don’t overleveraged; always use a stop loss; ensure you’re taking profits as the price moves.
Having losing days is almost unthinkable if you enter and exit trades from market tops and bottoms. Regardless, proper risk and money management will ensure profitability.
Catching market tops and bottoms won’t turn you into a billionaire or savvy trader overnight. There are consequences for thinking the contrary and trying to overexploit the privilege.
As a beginner, be happy with the little wins. If you’re more experienced, aim for stability and steady equity growth.
Delayed trade entries and exits are some of the leading reasons behind lost accounts. Fortunately, traders can prevent them by catching market tops and bottoms.
The easiest way for this is by using the Top Bottom Reversal Indicator asap by clicking here for a special offer. While enjoying the signals, never forget your risk management rules, and only pursue realistic goals.
There are more than enough market opportunities to employ the indicator. Thus, don’t hesitate to share this article to help others on social media.
You can also ask questions, make suggestions, or share your results in the engaging comment section below.