Ever tried combining volatility and trend trading theories? Dive into this article to learn all about these strategies, benefits, and a new automated option.
Table of Contents
1. Introduction
As popularly advised, the best trading strategies comprise several distinct theories, two such being trend and volatility studies. Newbies may find this fusion challenging and impractical for several reasons.
Fortunately, this concise article shares an effective yet flexible approach. As a perk, readers will also uncover a novel, groundbreaking tool for bolstered trading automation.
2. The Role of Trend Analysis and Volatility Concepts in Technical Trading Strategies
Every experienced technical analyst understands how impactful trend and volatility principles can be in trading.
Each unique study uncovers deep insights into markets’ current and imminent nature. Hence, combining both in a comprehensive strategy makes all the difference in attaining and sustaining success.
Trend analysis reveals periods of sustained bullish or bearish runs, which are most favorable for trading. As newer swing highs/lows keep breaking old ones, trade entries in such directions result in maximum wins.
On the other hand, price fluctuation studies help traders understand when to engage or avoid the market. Typically, the former is the case when whipsawing is low, and the latter when it is high.
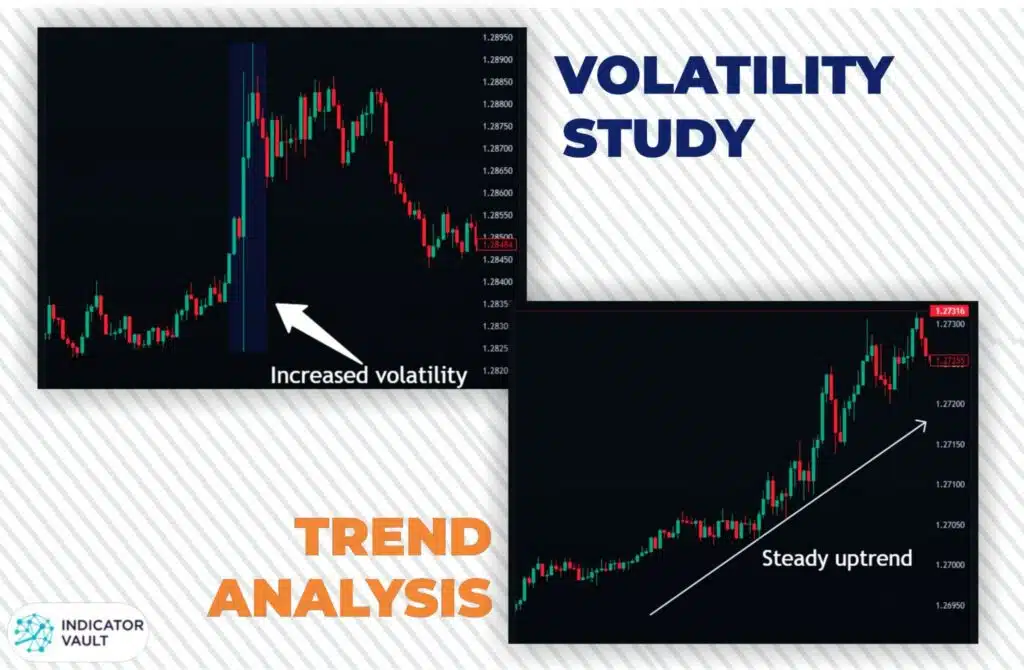
Analysts have proven success by specializing only in either principle. However, the following sections contain a general approach to both for combination:
2.1 Simplified Trend Analysis Techniques
As discussed, the ultimate goal of trend analysis is to detect periods of significant bullish or bearish price momentum. Traders can then open positions based on their findings concerning the direction.
Thus, below are a few popular ways to reach such conclusions:
2.1.1 Support/Resistance Trendlines
Imaginary lines at specific chart levels have proven to prevent prices from moving past them. Those above the market are called resistance trendlines and those below – support.
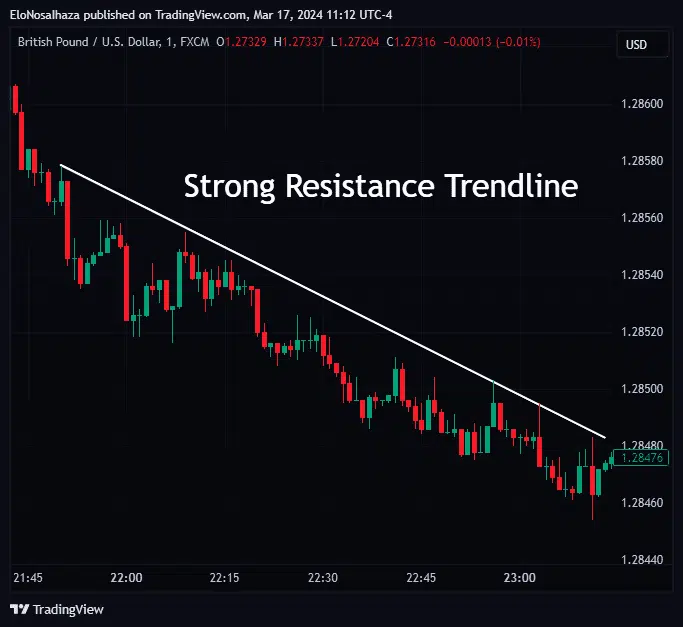
For trend analysis, technical traders draw these diagonal lines, optimistic that market price will respect them as in the past. They connect the highs/lows or open/close candlestick levels, extending them beyond the current price for forecasts.
2.1.2 Indicator Signals
Several indicators can also provide meaningful insight into an asset’s ongoing trending or consolidating nature. One such is the Moving Average (MA).
Its working aims to smoothen price, graphically represented as a single wavy line.
Traders adopt it in several ways, side by side on the chart with the desired financial instrument.
The cross of one or more MAs with price helps many foresee a long-, short-, or intermediate-trend approaching.
2.1.3 Classical Price and Chart Patterns
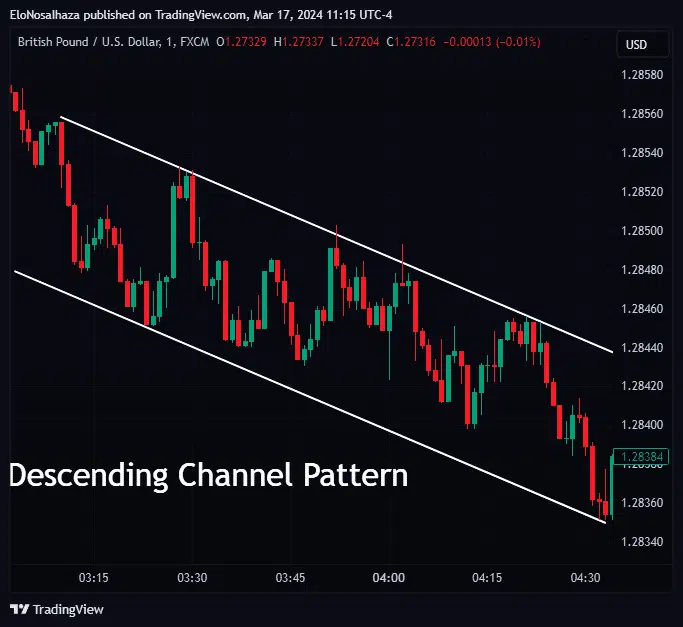
Several price and chart patterns, including channels, flags, and triangles, hint at the inception or continuation of price trends.
For example, channels form from two parallel trendlines below and above the market, as seen below:
Ascending and descending flags, also popular among technical analysts, predict the extent of the market’s rise and fall when already trending.
2.2 Volatility Trading: Risk Management Pointers
Volatility levels in combined trading strategies enlighten traders on the extent of market fluctuation at any time. The following are some fundamental risk management reactions when it increases, causing uncertainty:
2.2.1 Adjust Position Sizing
Forecasting precision significantly drops when the market becomes too erratic. Thus, one’s risk tolerance should reflect such doubt.
The finest traders avoid overleveraging this period and significantly adjust their position size when taking new opportunities. Otherwise, the consequences can be dire and contrary to their goals.
2.2.2 Set Stop Loss and Take Profit Orders
Take profit and stop loss orders should accompany every position, especially when the markets become more volatile.
Like the lot size, these levels depend on risk tolerance, expectations, long-term goals, and several other factors.

By contrast, traders can be more flexible during low volatile conditions.
3. Breaking New Grounds With The Two-in-One Trend Volatility Bundle
Younger traders may struggle to find a rhythm with the trend-volatility combo despite its proven efficiency.
In many cases, analysis typically becomes more meticulous with several nuts and bolts. The psychological toll and limited flexibility can also backfire, forcing initial enthusiasts to explore less complicated options.
Luckily, Indicator Vault has developed the Trend Volatility Bundle to handle all the heavy lifting for pros and novices alike.
The TradingView indicator combines many theories for a well-rounded, winning strategy, including trend and volatile trading principles.
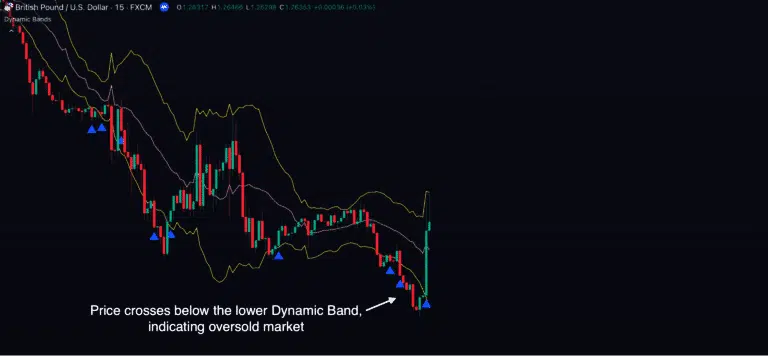
In short, below are some benefits subscribers enjoy from its adoption:
- Awareness of high-probability trading opportunities from thorough analysis
- Satisfaction, trusting the comprehensive market study from three technical perspectives
- Freedom to explore multiple markets and timeframes desired
- Confidence to never miss promising setups, thanks to the timely alerts from within and outside the platform
Click here to verify these and several more perks while reaching your trading goals today!
4. Conclusion
Most of the best trading strategies integrate multiple unique concepts (such as trend and volatility studies) to discover favorable setups.
They come with their fair share of setbacks, including increased complexity, optimization difficulty, and limited flexibility. Hence, the Trend Volatility Bundle is highly recommended for high-probability signals with no effort.
Please share this article with any ambitious technical analyst for an improved understanding of this topic. Remember also to join the engaging discussions in the Comment Section.

