This chart patterns cheat sheet will help you quickly recognize the most important formations in technical analysis and understand how to trade them effectively. Instead of memorizing endless definitions, use this practical guide to apply chart patterns cheat sheet strategies directly to your trading.
Table of Contents
1. What is a chart pattern?
A chart pattern is a form inside a price chart that helps to predict what prices will do next based on previous behavior. Chart patterns are the backbone of technical analysis and need a trader to know precisely what they are looking at as well as what they are searching for.
Does it sound familiar? I bet you’ve known or heard this term before, since everyone talks about it when trading. All this theory feels the same, you may think…
But we have something else. We won’t list all the chart patterns that are on the market right now and give you just the plain definition.
Why?
Because it’s boring. And this chart patterns cheat sheet approach is meant to simplify everything for you.
I know, if you want to, you can easily search it on google and there will be 2,530,000,000 results in 0.46 seconds
With Indicator Vault, we make it short and convenient for you.
In this part, we’ll go through how to leverage these formations using a chart patterns cheat sheet mindset – practical, clear, and directly usable.
It is not enough to understand how the tools function; we must also learn how to utilize them.
2. 3 Main Groups of Chart Patterns
Let’s quickly go through the chart patterns and classify them based on the signals they provide – exactly how you would structure them inside a chart patterns cheat sheet.
2.1 Reversal Chart Patterns
Reversal patterns are chart formations that indicate that the current trend is poised to shift direction.
When a reversal chart pattern emerges during an uptrend, it indicates that the trend will reverse and the price will shortly fall.
In contrast, if a reversal chart pattern is observed during a downturn, it indicates that the price will rise later.
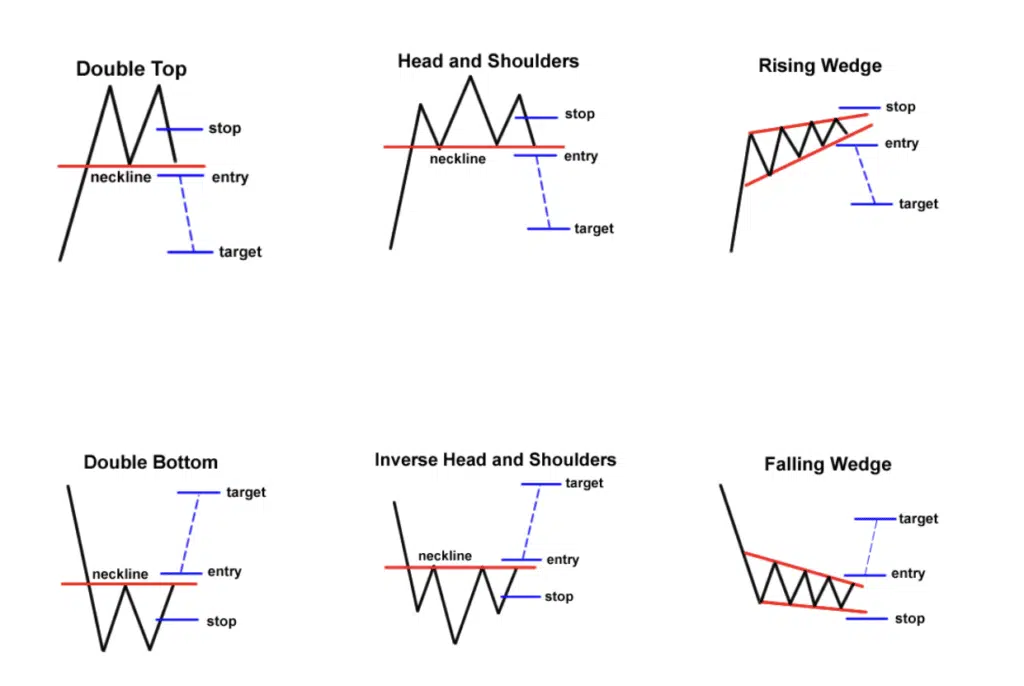
Just place an order beyond the neckline and in the direction of the new trend to trade these chart patterns. Then aim at a target that is around the same height as the formation.
For example, if you detect a double bottom, put a long order at the top of the formation’s neckline and aim for a target equal to the distance between the bottoms and the neckline.
Don’t forget to set your stops in the interest of adequate risk management! A decent stop loss might be placed towards the center of the chart formation.
For example, you may split the distance between the double bottoms and the neckline by two and use that as the size of your stop.
2.2 Continuation Chart Patterns
Continuation chart patterns indicate that the current trend will restart.
They are also known as consolidation patterns because they demonstrate how buyers or sellers take a brief pause before continuing in the same direction as the previous trend.
Trends seldom go in a straight line up or down. They halt and move laterally before “correcting” downward or upward to resume the main trend.
We’ve already discussed various continuation chart patterns, including wedges, rectangles, and pennants. Wedge patterns may be classified as reversal or continuation patterns, based on the trend on which they originate.
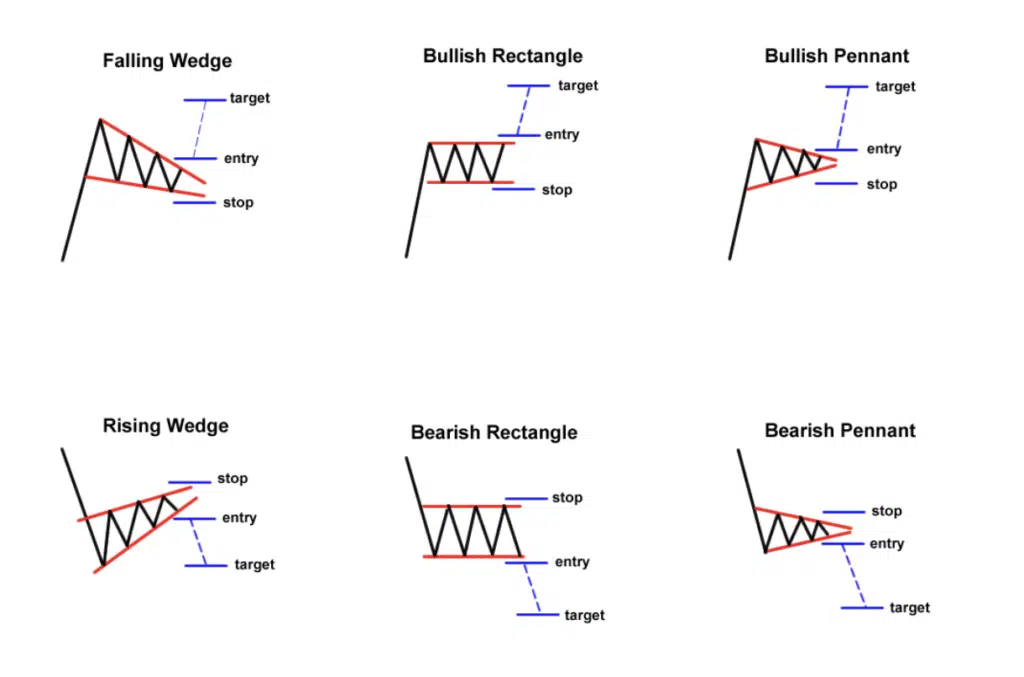
Just place an order above or below the formation to trade these patterns (following the direction of the ongoing trend, of course).
Finally, for wedges and rectangles, aim for a target that is at least the size of the formation.
When it comes to pennants, you may aim higher and target the height of the mast.
Stops are often set above or below the actual chart formation for continuation patterns.
When trading a bearish rectangle, for example, position your stop a few pips above the rectangle’s top or resistance.
2.3 Bilateral Chart Patterns
Bilateral chart patterns are more difficult to interpret since they indicate that the price may move in either direction.
Omg…Isn’t my trading journey hard enough… What is it now? (That’s what I thought when I first learnt about it)
A bilateral signal.
Here is when triangular formations come into play. Remember how we said that with triangles, the price might break to the topside or the downside?
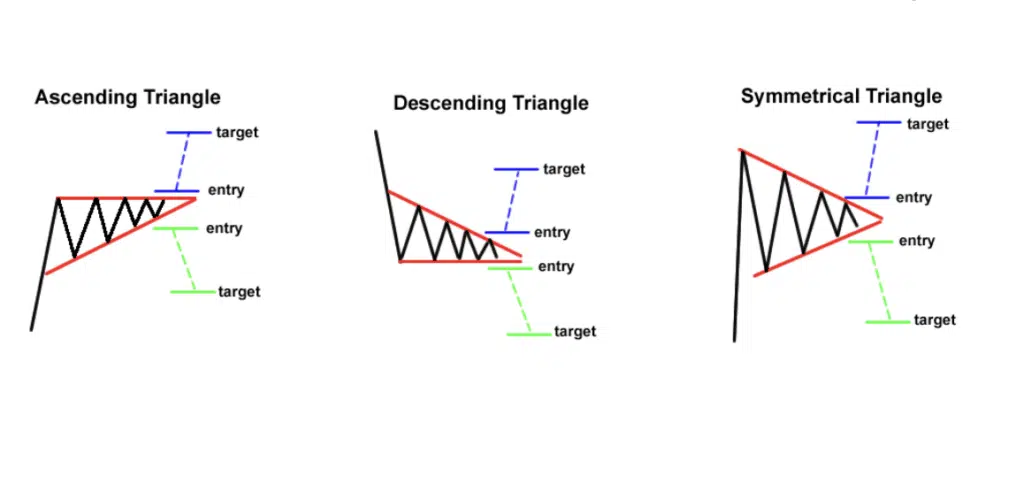
To trade these chart patterns, think about both options (upside or downside breakout) and put one order on top of the formation and another at the bottom.
If one order is activated, the other may be cancelled. You’d be a part of the action either way.
The only issue is that if you put your entry orders too near to the top or bottom of the formation, you may catch a false break.
So be cautious, and don’t forget to set your stops!
3. Okay, but how to set stop loss and gain profit?
I will show you one simple way to do it.
Introducing: The Logic Trendline indicator for Tradingview. It automatically draws the correct trendline so you can be confident price respects your trendlines more often… your stop loss is safer… and you could win more trades
When price breaks through the Logic Trendline, there’s a high probability that a REVERSAL will happen In other words, price will continue in that reverse direction.
So you can just sell when price breaks through an uptrend line… and buy when price breaks through a downtrend line.
By the way, the Logic Trendline for Tradingview indicator will generate an ALERT for you as soon as a trendline break happens.
So you will never miss out on an important trade…
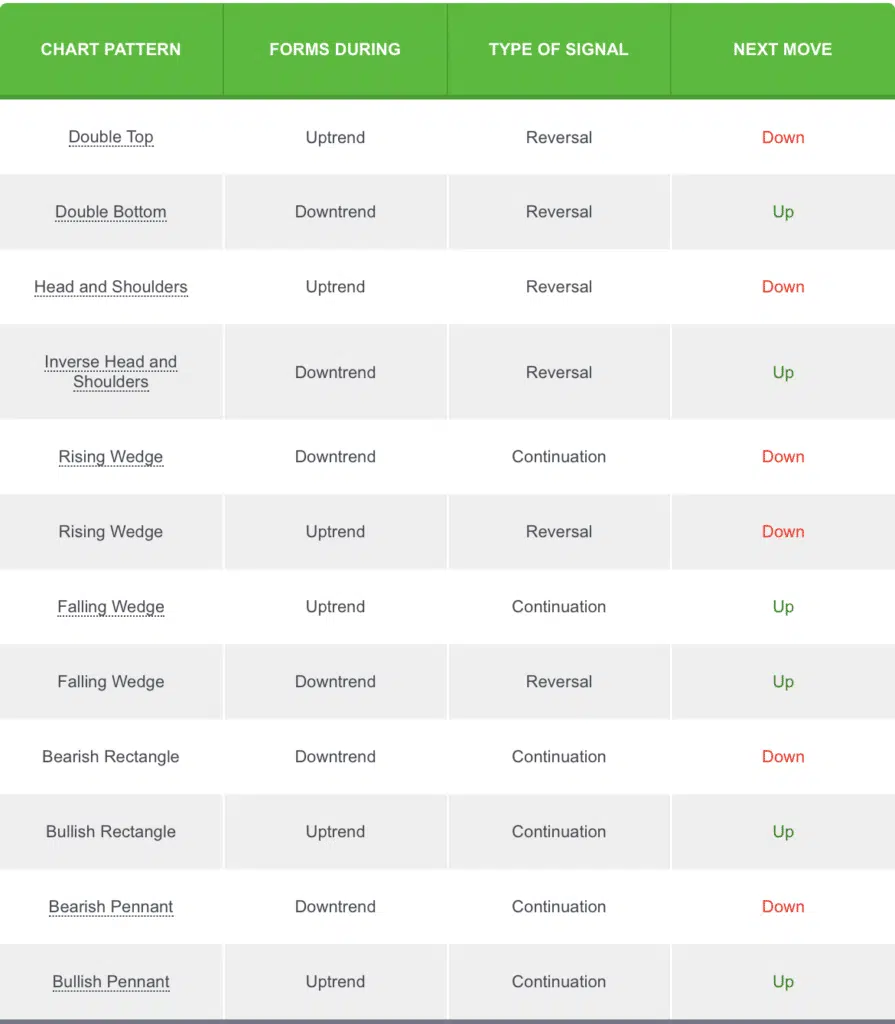
4. The chart patterns cheat sheet you’re craving for!
Like we promised, here’s your complete chart patterns cheat sheet.
Instead of memorizing definitions, use this chart patterns cheat sheet to quickly identify pattern types, expected direction, and trade structure.
This visual chart patterns cheat sheet helps you categorize formations into reversal, continuation, and bilateral setups at a glance.
Also, as you may have seen, the triangle forms (symmetrical, ascending, and descending) are not included in this cheat sheet.
This is because these chart patterns may appear in either an uptrend or a downtrend and can indicate either a trend continuance or a trend reversal.
Sounds complicated, doesn’t it? But that’s life. You need to put extra effort to earn your title (practice more, I mean).
5. The bottom line
You should bookmark this page and use this chart patterns cheat sheet whenever you need to double-check pattern signals before risking your money.
A structured chart patterns cheat sheet approach helps you trade with more clarity and less hesitation.
Save it. Use it. Make it yours.
If you’re looking for some knowledge-trading articles or an update on our newest indicators, the following articles will be helpful:
What do you think these tips help you? Comment below to share your thoughts!
Find this article useful? Share this blog with your friends on social media!