Table of Contents
1. Introduction
Traders and market makers have long tossed around several ideas for uncovering high-probability trades. The pivotal reversal system is one famous example.
In this article, you’ll learn the essentials of this trading knowledge, especially for price reversals. It also shares a highly recommended indicator to ease the process.
2. Understanding Pivot Points
Pivotal trading strategies, whether reversals or breakouts depend on specific “pivot points.” Although imaginary, market prices have been highly responsive to them in the past.
Traditional pivot points are chart levels calculated from a previous period’s high, low, and close prices. Despite their possible availability from any timeframe, those taken from the daily charts are most acceptable for greater accuracy.
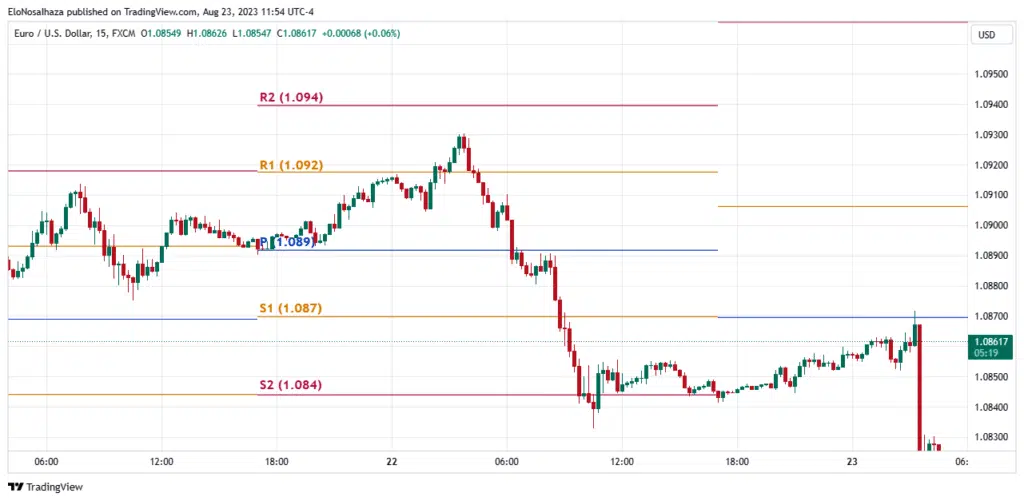
Hence, every day has new pivot points.
Note: The points start from the beginning of a trading day. In Forex (solely used in this article to avoid confusion), it is the Asian session. Thus, the timezone your trading platform has adapted will influence where it appears.
People have adapted these levels differently, including using tools like the Fibonacci. Nonetheless, here is a breakdown of the traditional positions:
2.1 Central Pivot Point (P)
The Central Pivot Point is the primary level that gives rise to all others. Classically, it is the average of the previous day’s high, low, and close prices.
P = (High + Close + Low)/3
2.2 Support Levels (S)
The support levels are below the Central Pivot, and traders anticipate them to keep prices above. A strong support level will ensure they don’t break through it significantly, unlike a weak one.
Depending on your strategy, you can have as many as five support levels, but most traders are content with three.
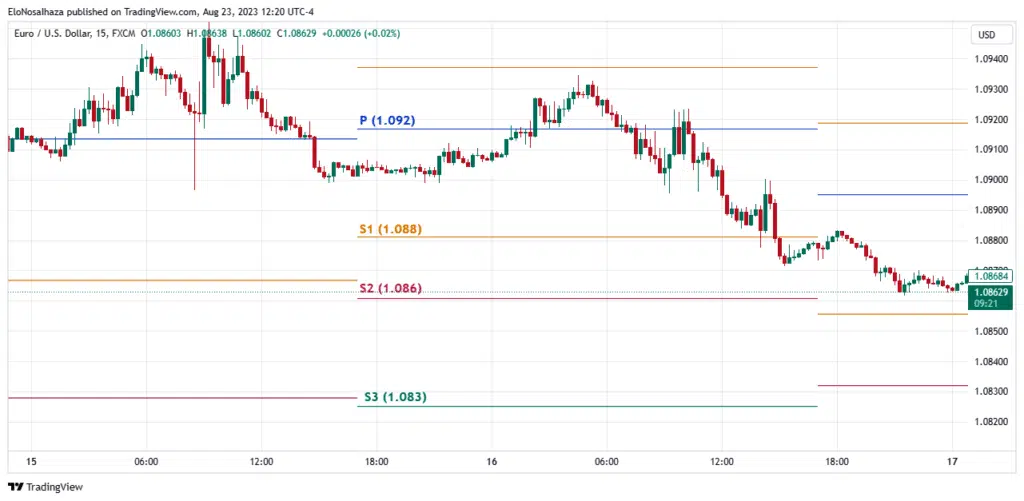
Below is the math work behind Support 1 (S1), Support 2 (S2), Support 3 (S3) levels:
S1 = P – (High – Low)
S2 = P – 2 * (High – Low)
S3 = P – 3 * (High – Low)
2.3 Resistance Levels (R)
Pivotal strategy traders treat these price levels as resistance zones. Like the Supports, the weak ones allow prices to surge through them, unlike the strong ones, which hold prices below.
R1 = P + (High – Low)
R2 = P + 2 * (High – Low)
R3 = P + 3 * (High – Low)
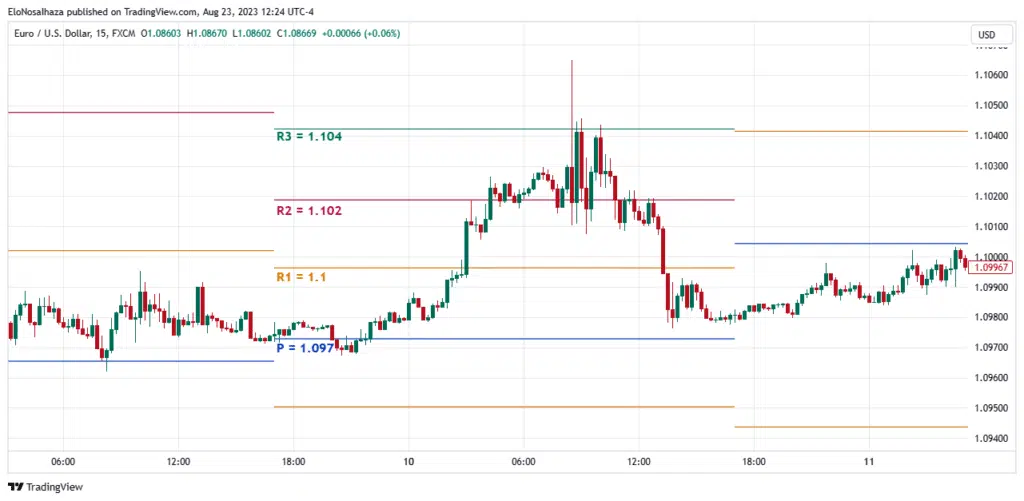
Rest assured, you won’t need to make these calculations manually if your trading platform has a standard indicator for this.
3. Price Reversal Strategy With Pivot Points
Spotting reversals is just one of the many strategies from the pivot points.
As discussed, traders look for breakouts from them on intraday charts. They also help in picking potential tops and bottoms in range-bound trading.
However, if you’re only interested in trend reversals, you must learn basic Japanese candlestick patterns to make the most of pivot points. Some include the Doji, Hammer, and Shooting Star, with various interpretations when they appear.

Basically, when prices hit (and sometimes move significantly away from) any of the pivot points, expect a price reversal based on the candlesticks signal.
It could be the Central Pivot Point or any of the Support or Resistance levels, but the price may revert to its prior bullish or bearish nature after testing them.
3.1 Bullish Reversal Example With Pivot Points
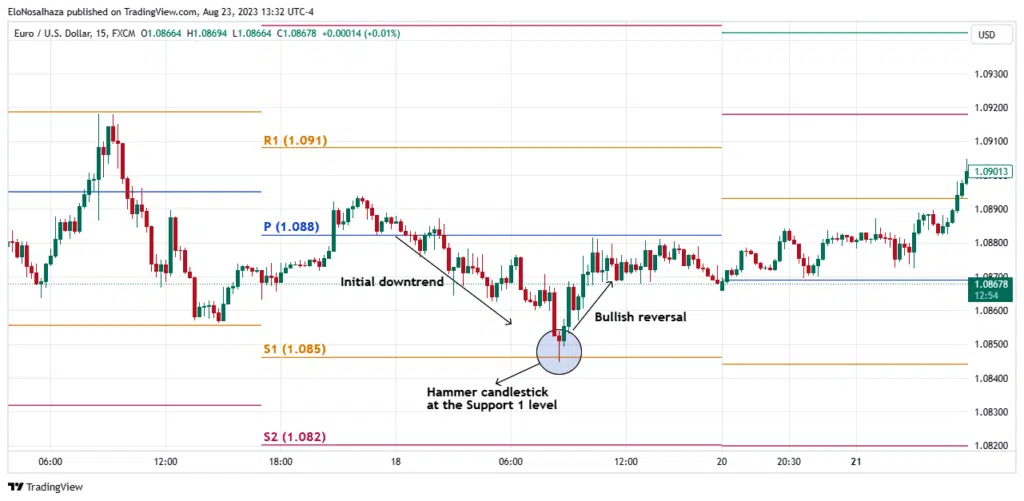
On November 18, 2023, the EUR/USD price hovered around the Central Pivot Point until 2:30 a.m. (UTC-4), when it began a bearish price run. The intraday trend kept breaking new lows as the day progressed.
At 8:45 a.m. (UTC-4), the price hit the Support 1 level (1.085), forming a Hammer candlestick. It immediately reversed into a sustainable bullish trend. Reversal scalpers and day traders would have benefitted from the resulting uptrend.
3.2 Bearish Reversal Example With Pivot Points
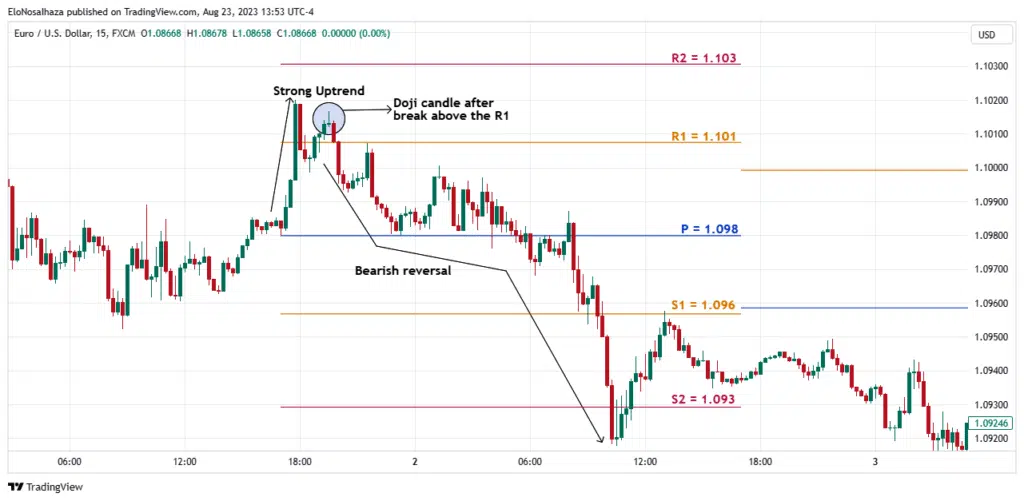
From 2 p.m. (UTC-4) on August 23, 2023, EUR/USD commenced a short-term bullish rally. It hit the pivotal points’ first resistance level hours later, and a Doji candlestick pattern signified a potential bearish reversal.
The expected downtrend soon manifested, taking the price through the P, S1, and S2 levels around 1.09178.
4. The No. 1 Pivotal Reversal Trading Companion
Admittedly, the pivotal reversal strategy seems quite simple.
If your trading platform supports an indicator for it, you don’t even have to do any math work to get your levels. Extra knowledge of Japanese candlestick patterns, and you’re good.
Notwithstanding, there’s a recommended trading tool that won’t only deliver pivot points but signals the ideal entry points for price reversals – Pivotal Reversal Pro for TradingView.
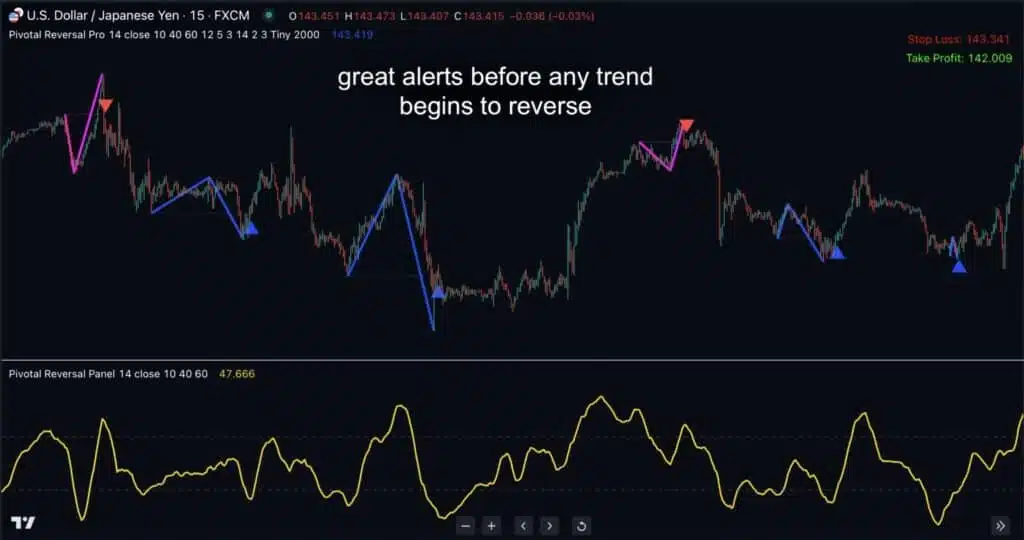
The Pivotal Reversal Pro works with Indicator Vault’s custom pivotal points and a smoothed RSI. The latter determines overbought and oversold price levels, while the former signals when a trend has ended.
Below are some of the many ways you can benefit from this indicator:
- Receiving the earliest entry signals of upcoming trends
- Zero worries about potential “pivot fakeouts” due to the tool’s certainty about when trends fade
- Freedom to work in any desired timeframe
- Pop-up alerts, sound, and email notifications of signals
Click here to access this strategy today, and you’ll never have to worry about late entries or exits.
5. Conclusion
Pivotal reversals are one of the many strategies from pivot points. It involves a main pivot level and resulting support and resistance zones, from where you’ll expect the price reactions.
To make life easier, use Pivotal Reversal Pro for TradingView. It will do all the work and simply alert you when to buy and sell with arrows.
Feel free to ask questions and make suggestions about this strategy and the indicator in the Comment Section. Also, please share this article with other novice and expert traders to improve their trading knowledge.


