Momentum trading is one of the simplest yet most powerful ways to approach the market. Instead of predicting tops and bottoms, momentum traders focus on joining a trend while it’s still strong. But here’s the truth: momentum works even better when paired with price action and volume analysis.
In this article, you’ll discover how price action, volume, and momentum theories fit together into one unified strategy. More importantly, you’ll see how traders can apply these methods to spot high-probability setups across any market or timeframe.
Table of Contents
1. What is momentum trading?
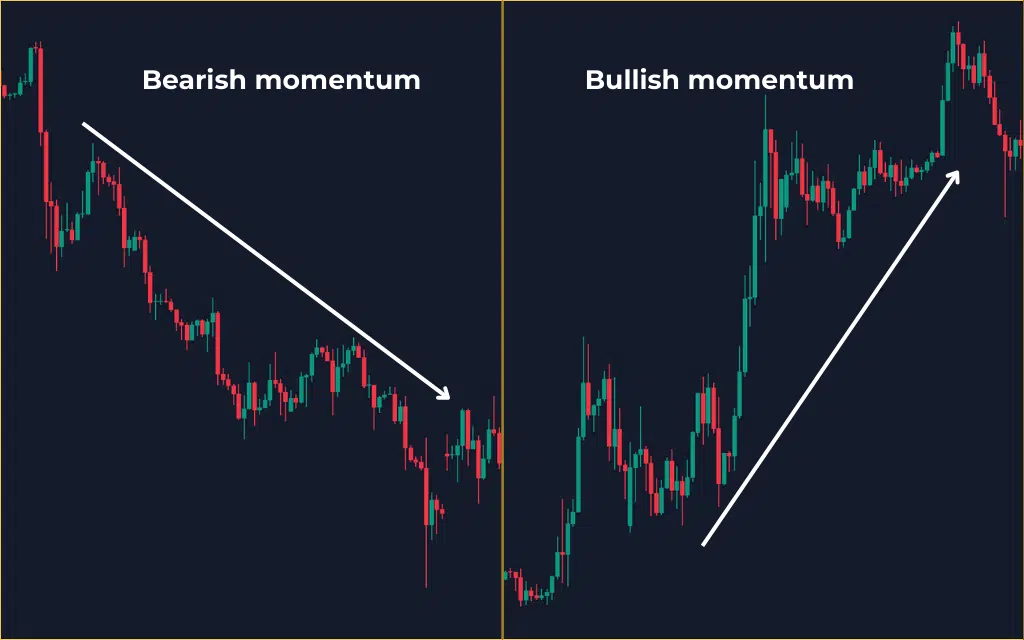
Momentum trading is based on a simple principle: assets that are moving strongly in one direction are likely to continue moving that way for some time. Instead of fighting market direction, traders align themselves with it, riding the wave of buying or selling pressure.
At its core, momentum trading focuses on:
- Strength of movement: How fast and far the price is moving.
- Trend continuation: Identifying moments when the market is most likely to keep pushing in the same direction.
- Entry and exit timing: Positioning early in the move and exiting before momentum fades.
But while the concept is straightforward, consistently applying it in live markets is more complex. That’s why momentum traders often rely on proven strategies and structured systems to guide their decisions.
2. Effective Momentum Trading Strategies
There are many approaches to momentum trading, but all of them share one goal: capture price moves when the market shows strong conviction.
2.1. Trend following
Momentum traders often look for markets already trending and join the move. By identifying pullbacks within a trend and re-entering at the right time, they ride momentum without chasing tops or bottoms.
2.2. Breakout trading
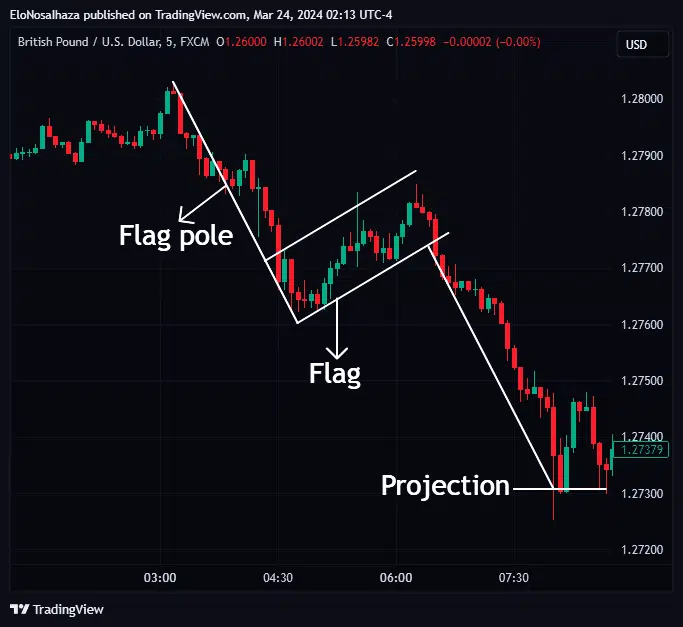
Breakouts from chart patterns like triangles, flags, or ranges can trigger strong momentum moves. Traders enter when price pushes beyond resistance or support, confirmed by volume or momentum signals.
2.3. Indicator-based signals
Some traders use momentum indicators like RSI, MACD, or stochastic oscillators. These tools measure the speed and change of price movements. However, the drawback is that most of them are lagging indicators, often signaling after the move has already begun.
2.4. News-driven momentum
High-impact events (central bank announcements, geopolitical news) can spark momentum trades. Traders capitalize on the volatility, but risks are higher due to unpredictable reversals.
The challenge for all momentum traders lies in filtering noise, confirming true strength, and avoiding late entries. That’s why combining momentum with other pillars of technical analysis – price action and volume – creates a much stronger strategy.
3. Combining Price Action, Volume, and Momentum in a Trading Strategy
3.1 Why use multiple theories together?
Relying solely on one method can limit accuracy. Price action alone may give signals without context. Volume confirms activity but doesn’t show direction. Momentum reveals strength but may mislead in sideways markets.
By combining all three – price action, volume, and momentum – traders gain a 360-degree view of the market.
3.2 Price Action: The market’s language
Price action trading involves studying how price moves over time, often through candlestick and chart patterns.
For example:
Candlestick patterns
- Bullish engulfing: Signals potential continuation after consolidation.
- Doji: Warns of possible reversal when momentum stalls.
Chart patterns
- Flag pattern: Indicates trend continuation after a brief pause.
- Head and shoulders: Suggests potential reversal.
- Triangles and wedges: Signal breakouts where momentum may accelerate.
3.3 Volume: The fuel behind the move
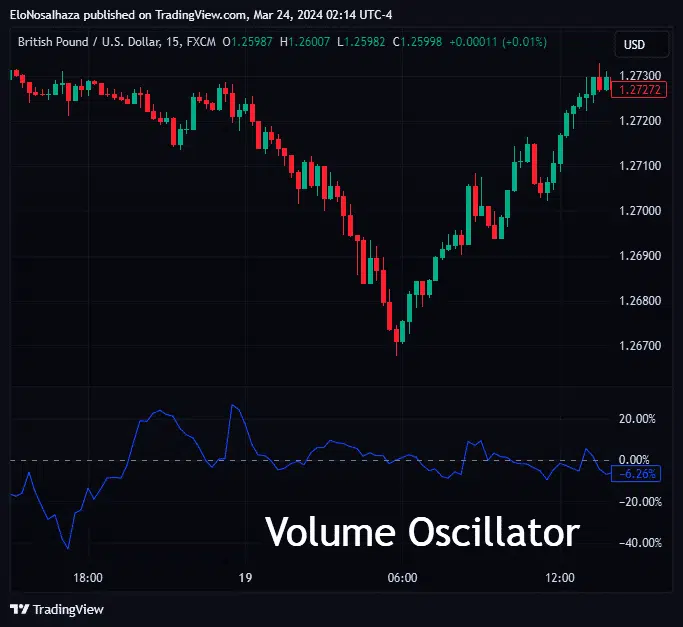
Volume measures how many shares, contracts, or coins are traded in a given period.
- High Volume + Price Breakout = Strong conviction → More reliable momentum trade.
- Low Volume + Price Push = Weak conviction → Higher risk of false breakout.
Indicators like Volume Oscillator, On-Balance Volume (OBV) or Chaikin Money Flow (CMF) help analyze whether institutional money is supporting the trend.
3.4 Momentum: Measuring strength directly
Momentum shows how quickly price is moving. Traditional tools like RSI or MACD are common, but they suffer from lag and false signals in ranging markets.
By unifying price action, volume, and momentum:
- Price action gives the setup.
- Volume confirms participation.
- Momentum ensures strength and timing.
This creates a strategy that’s more precise, reliable, and adaptable to market conditions.
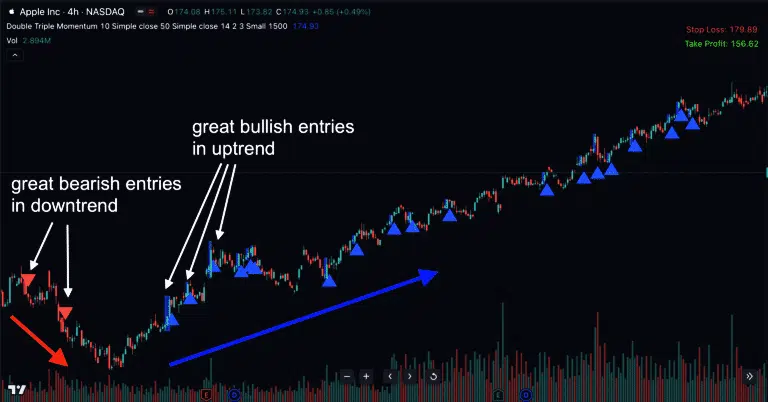
4. Double Triple Momentum: A Next-level momentum trading tool
While the combination of price action, volume, and momentum is powerful, applying it manually can be time-consuming and prone to human error. That’s where the Double Triple Momentum indicator for TradingView takes momentum trading to another level.
Click here to see more real examples
Here’s how it helps traders:
4.1 Double & triple confirmation
Most indicators provide one signal. Double Triple Momentum stacks multiple momentum calculations together, filtering out weak moves and highlighting only high-probability momentum shifts.
- Double Momentum layer captures short-term bursts of strength.
- Triple Momentum layer aligns with broader momentum trends.
When both align, traders know they’re entering at a point where momentum is strongest.
4.2 Adapts to market conditions
Markets are not static – they move from trending to ranging conditions. Double Triple Momentum adapts dynamically, helping traders avoid false signals in choppy markets while staying aggressive in trending ones.
4.3 Visual clarity on charts
Instead of juggling multiple indicators cluttering your chart, Double Triple Momentum consolidates everything into a streamlined system. Traders can instantly see whether momentum is building, fading, or reversing.
4.4 Practical benefits for traders
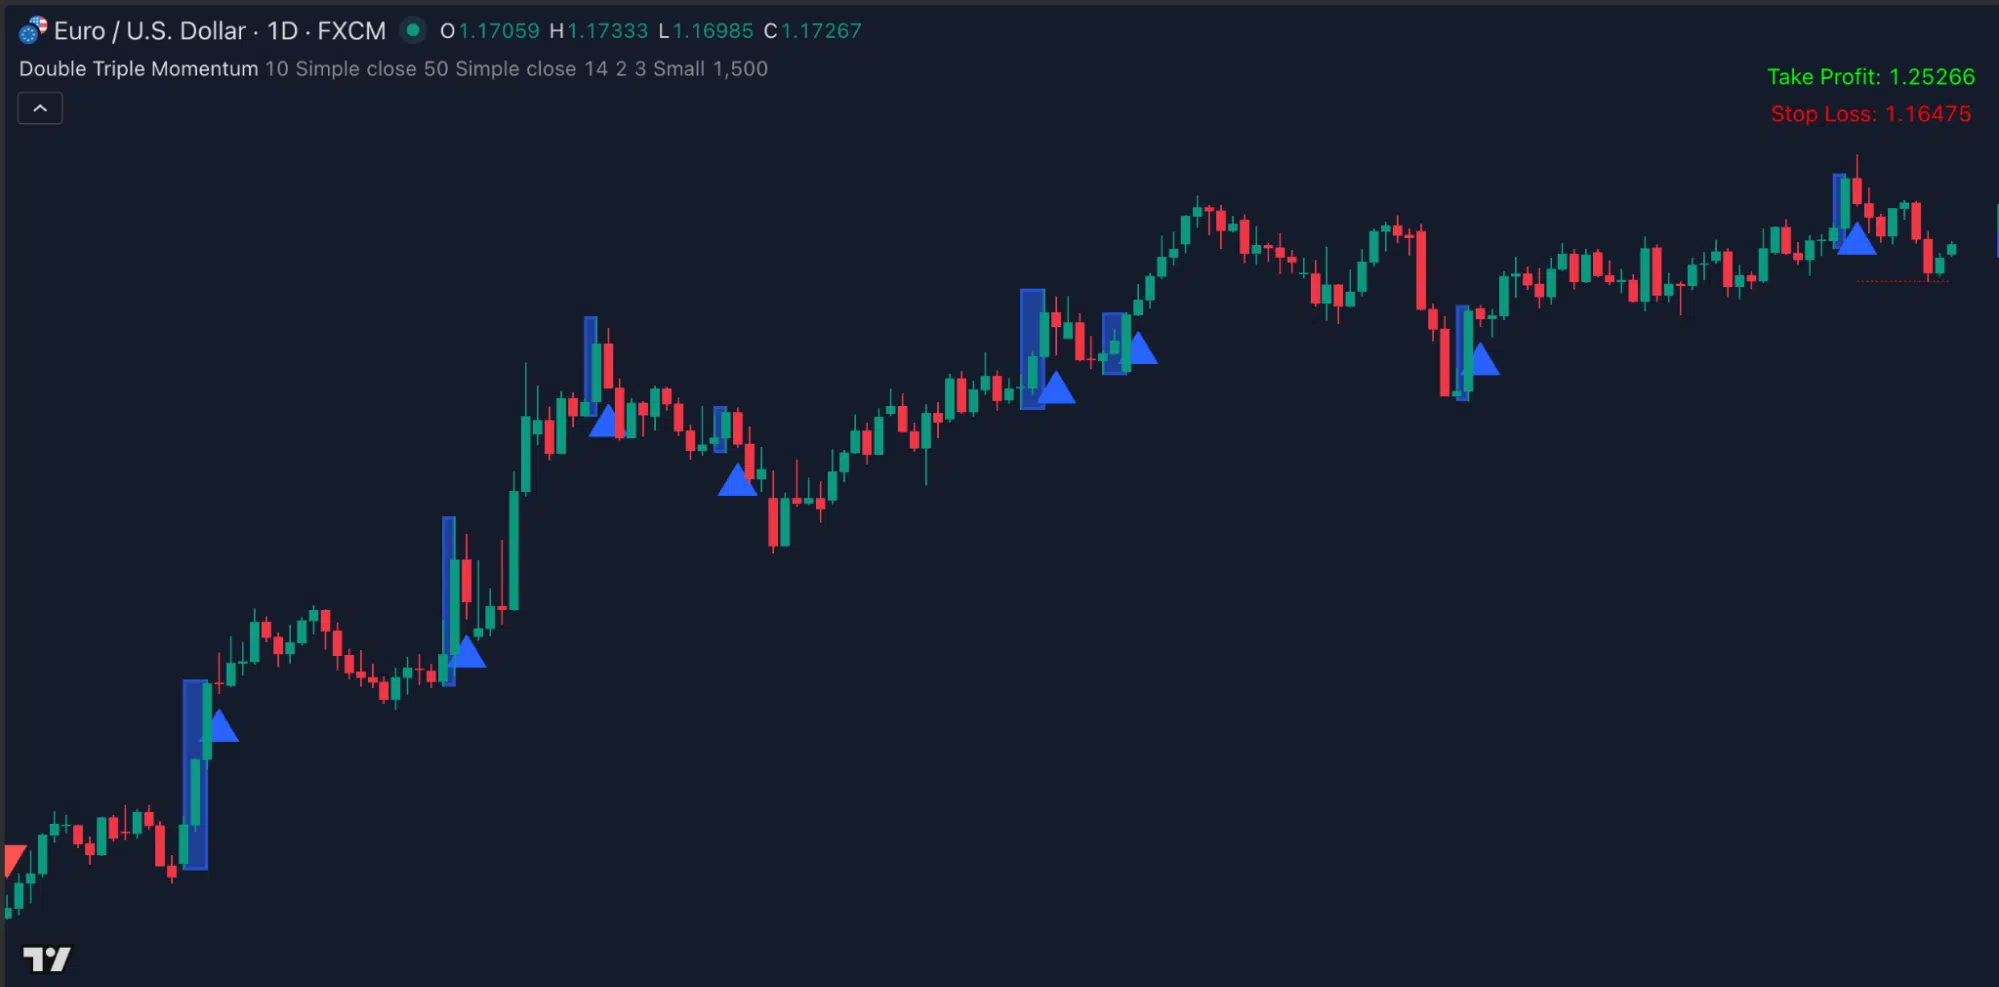
- Earlier entries: Signals appear when momentum starts, not after the move has passed.
- Fewer false trades: Noise is filtered out, saving traders from costly mistakes.
- Works on all markets: Whether trading forex, stocks, crypto, or indices, the system adapts seamlessly.
- Timeframe flexibility: From scalping on the 5-minute chart to swing trading daily charts, momentum principles apply across the board.
5. Conclusion: Momentum Trading with an edge
Momentum trading has stood the test of time because it taps into the natural tendency of markets to move in waves. But the biggest challenge for traders has always been separating true momentum from noise.
By combining price action, volume, and momentum, traders create a strategy that adapts to changing conditions and increases precision. And with advanced tools like Double Triple Momentum for TradingView, this strategy becomes more efficient.
For traders looking to master momentum trading, the future lies in unifying traditional theories with modern, adaptive indicators. With the right strategy and the right tools, you won’t just follow momentum – you’ll stay ahead of it.