Learn how to trade Wolfe Waves without the manual drawing headache. Discover the geometric sweet spot that predicts reversals and how to let Easy Wolfe Wave do the math for you.
Table of Contents
1. Introduction

Most traders struggle because they treat the market like a series of random events. But what if you could see the invisible structure behind price reversals?
The Wolfe Wave is one of the most reliable chart patterns for spotting trend exhaustion. It’s based on a specific five-point struggle between buyers and sellers that creates a predictive geometric path for price.
2. The anatomy of a Wolfe Wave
A valid Wolfe Wave must meet specific geometric criteria to be considered tradable. It consists of five points that form a narrowing wedge:
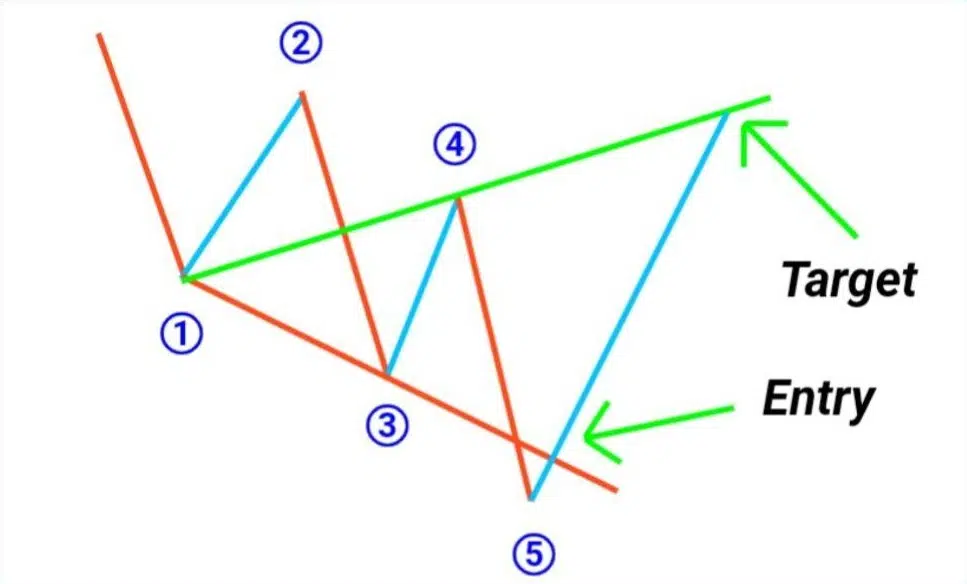
- Points 1, 2, 3, and 4: These create the channel. Point 2 is the first high (in a bullish wave), Point 3 is the first low that drops below Point 1, and Point 4 is the peak that stays below Point 2.
- The Sweet Spot (Point 5 – Entry): This is where the magic happens. Price will usually overshoot the trendline connecting Points 1 and 3. This is a false breakout designed to trap traders before the real reversal begins.
- The EPA Line (Estimated Price at Arrival – Target): This is your ultimate target. You draw it by connecting Point 1 and Point 4. The goal is for prices to hit this line at some point in the future.
3. The 3 Pillars of Wolfe Wave Trading
To trade this successfully, you need more than just a pattern; you need a system.

3.1. The Entry Strategy
Most beginners jump in the second price touches the 1-3 trendline at Point 5. Professionals wait for reversal price action. Look for:
- A rejection candle (like a long-wicked hammer).
- A break of structure on a lower timeframe.
- The price crossing back inside the 1-3 trendline.
3.2. Time Symmetry (ETA)
Wolfe Waves have a time component called the ETA (Estimated Time of Arrival). If you draw a line connecting Point 1-3 and another connecting Point 2-4, the place where they intersect horizontally often predicts when the price will hit the EPA target.
3.3. Filtering Out Fake Waves
Not every wedge is a Wolfe Wave. For a high-probability trade:
- Symmetry is King: The waves should look balanced. If Point 3 is tiny and Point 5 is massive, the geometry is broken.
- Point 4 must be inside: In a bullish setup, Point 4 must stay within the channel created by 1 and 2. If it breaks out too early, the pattern is void
4. The reason we build Easy Wolfe Wave indicator for Tradingview

Let’s be real: spotting these five-point moves in real-time is a headache. By the time you’ve manually drawn your lines, the move is often halfway over. That’s why we built Easy Wolfe Wave for TradingView, to take the manual labor out of the equation so you can focus on the trade, not the drawing tools.
The manual method of drawing these waves is prone to human error and wishful thinking. You might draw a wave just because you want to take a trade.
Easy Wolfe Wave for TradingView removes the bias:
- Automated Detection: It scans every candle to find perfect 5-point structures so you don’t have to.
- Real-Time Targets: It automatically plots the EPA target line the moment the pattern forms.
- Multi-Timeframe Use: Works on everything from 1-minute scalps to weekly swing trades.
5. Taking It Further: The Power of Confluence
While the pattern is strong on its own, the pro way to trade it is by layering it with other tools. Here are two strategies to maximize your edge:
5.1. Strategy Integration: Easy Wolfe Wave + Fibonacci
While the pattern is a beast on its own, adding confluence is how you separate the amateurs from the pros.
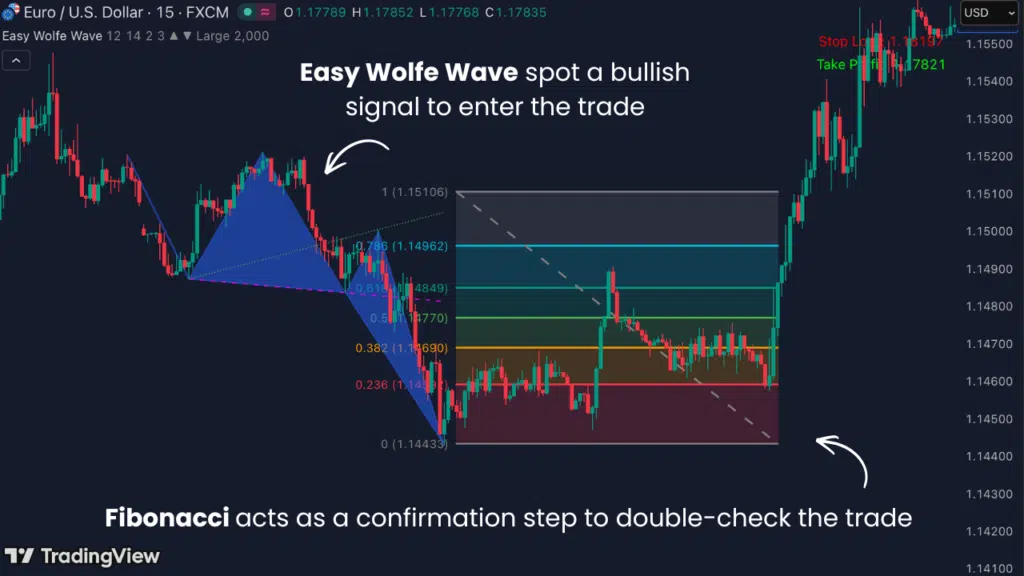
Take this EUR/USD 15-minute chart example. By using the Easy Wolfe Wave indicator to identify the structure and layering on Fibonacci Extensions, you get a precise map of where the reversal is likely to happen.
On this chart, price tanked through the 1.148 extension and reacted sensitively to the third standard deviation before snapping back. When the geometry of the Wolfe Wave aligns with these hidden Fib levels, your confidence in the trade doubles
5.2. The Smart Money Layer: Easy Wolfe Wave + Supply and Demand
If you want to maximize your profit, you can’t just trade the pattern, you have to trade the structure. Look at this GBP/AUD 3-hour chart for the ultimate SMC setup.

Once the indicator identifies a bullish bias, we don’t just jump in. We look for a break of structure (BOS):
- Wait for the price to break the high that created the last low.
- Look for a valid Demand Zone left behind by that break.
- By entering at the demand zone, you can secure a 1:5 risk-to-reward ratio.
6. Step-by-step video guide: Easy Wolfe Wave in action
Watch the video below to see how the indicator identifies the setup before the price even reaches the entry zone. You’ll see how to layer it with Fibonacci and Supply/Demand levels for maximum precision.
7. The Bottom Line
The Wolfe Wave is a window into the natural rhythm of the market. It gives you a clear entry, a safe stop-loss, and a math-based target.
However, the difficulty has always been the manual execution. Human error, subjective drawing, and the time required to scan multiple charts often lead to missed opportunities or, worse, bad entries.
Easy Wolfe Wave for TradingView changes the game.
If you’re tired of guessing where a trend might end and want to start trading with the confidence of market geometry, it’s time to add the Easy Wolfe Wave to your toolkit.