Did you know that one of the most common investments today is stock trading? Knowing how to examine stocks beforehand can help you choose stocks with more confidence as a beginner trader and maximize your earnings. Technical analysis of stock trends is one form of stock analysis that you can utilize. This type of study uses technical tools to display data on past stock market values.
Table of Contents
1. Technical analysis of stocks
Investors and traders utilize a variety of strategies when buying stocks, including technical analysis of stock trends. To put it briefly, this type of analysis aids traders in choosing whether to purchase or sell a stock.
Investors and traders must evaluate the price movement of a stock, comprehend the factors influencing its current price, and predict how the price will change in the future. Once the conditions affecting the stock price have been determined, the possibility of mistaken buying or selling by investors and traders is less likely.
The use of technical analysis of stock trends techniques to identify price trends is also possible.
There are some indicators that you must first be familiar with and adept at using in order to undertake technical analysis of stock trends. On the basis of previous price data, indicators perform a mathematical computation and display the results as a line or other graphical component on a chart. Indicators can identify trends in stock price and indicate the best times to enter and exit the market.
While traders can use technical analysis of stock trends to identify which companies will yield profitable returns in the near term, investors who want to buy and hold stocks over the long term also employ them. With the use of technical analysis, we can choose the ideal times to enter and leave a market.
2. Technical analysis indicators for stock trading
Technical indicators generally offer a broad overview of stock supply and demand as well as a psychological profile of the market. Indicators used in technical analysis of stock trends generally fall into two categories that you should be familiar with:
Overlays
Oscillators
Lines showing whether the stock price is rising or falling. The candle or bar can be seen with overlays above or below it. Overlays include things like Bollinger Bands and moving averages.
These are visible independently from the price movement chart and signal the start or end of a trend. The stochastic oscillator, MACD, and RSI are a few examples of oscillators.
2.1. MACD
MACD is used to display trend strength and is a popular tool in technical analysis of stock trends. The MACD line and the slower-moving signal line make up the two lines that make up this indicator.
The signal line shows that an uptrend is happening when it is above zero. A downtrend is also present if the line is below the zero mark.
By combining 2 of the most popular indicators – MACD and Bollinger Bands, we’ve created the best “trend identifier” of all time. Take a look at this chart to see how MACD Bollinger Pro works:
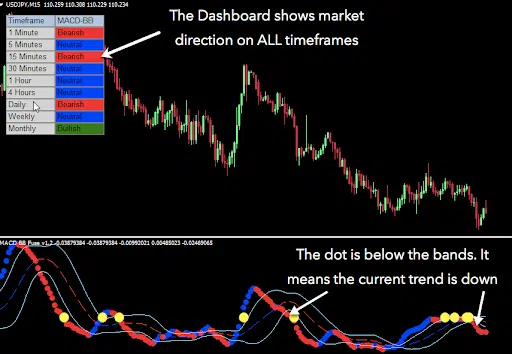
If you are interested, click here to see all the details
2.2. Relative Strength Index (RSI)
The RSI, which takes the shape of a middle number or zero, serves as a reference line for performing technical analysis of stock trends.
The RSI’s default range between 30 and 70 denotes overbought and oversold conditions, respectively. The asset is regarded as overbought if the price surpasses or approaches 70 on the RSI. On the other hand, if the price falls to or below 30, the asset is regarded as oversold.
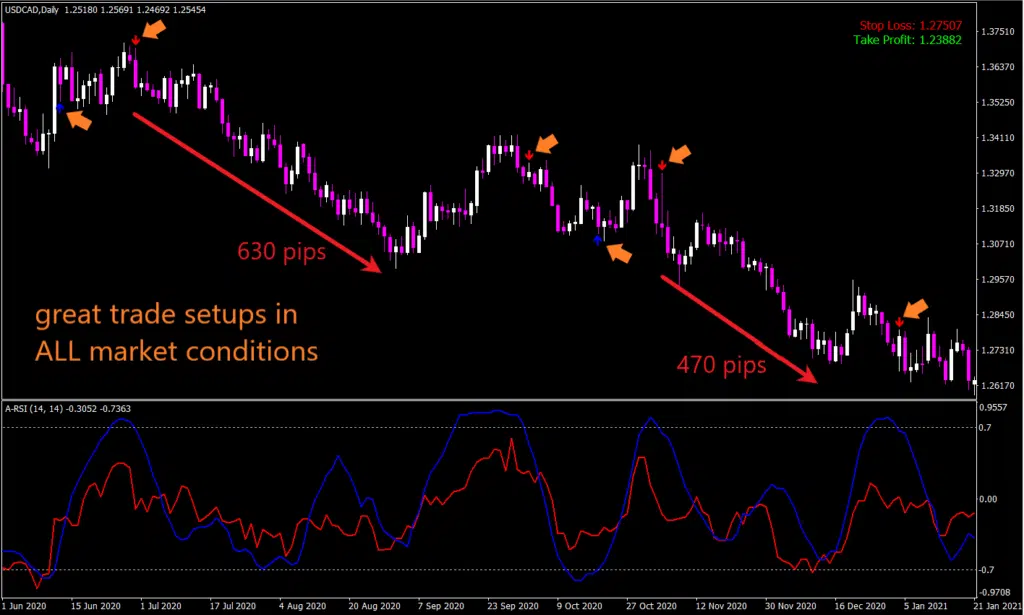
To bring about the most advanced custom RSI ever developed, here we have the A-RSI. This indicator is also a useful tool for determining support and resistance levels.
2.3. Stochastic oscillator
The current price in relation to the price range over a specific time period is measured using this indicator. The stochastic oscillator contains two lines at zero and one hundred, just like the RSI. Typically, the lines are blue and red. An upward trend is shown by the blue line crossing the red line, whereas a downward trend is most likely indicated by the blue line crossing the red line.
3. Conducting technical analysis of stocks
You can start by observing market movements, getting to know technical analysis indicators, and observing how history repeats itself to perform a technical analysis of stock trends.
As price movements are a reflection of the state of the market at the time, utilize market movements as a guide when conducting analysis. Natural calamities, political unrest, and market participants’ psychological states are only a few of the causes. For this reason, it’s essential to stay current with the news, ride the volatility wave, and have a solid understanding of trading psychology—specifically, your own.
Here is a simple tutorial that we’ve put together for a fundamental technical analysis of stock trends technique:
- Observe a trend developing on the price chart of a stock.
- To make buy and sell signals more obvious, mark support and resistance levels on the chart.
- To determine whether a stock is in an uptrend or downturn, use a moving average indicator.
- To ascertain whether the current trend may alter, use an oscillator.
- To reduce losses in stock trading, set a stop loss or a minimum price limit.
4. Conclusion
The prevailing belief among traders who perform technical analysis on stocks is that the past tends to repeat itself. Tools for technical analysis draw attention to recurring trends in stock prices, which facilitates profitable stock trading. It’s crucial to employ indicators that are tailored to your needs in order to make quick and accurate investment and trading decisions.
However, technical analysis of stock trends is not a trader’s all-purpose panacea. We also advise getting acquainted with fundamental analysis methods to help you make investment selections.
We’ve put up the articles 3 Popular Forex Trading Strategies To Trade More Profitably and Use QM Pattern and Divergence Solution to find high-probability trades to help you out a little. Check it out now!
Join Indicator Vault, utilize the variety of trading instruments offered, and establish yourself as a market power!