From a technical view, the MACD (Moving Average Convergence Divergence) is among the most popular and respected trading tools. It provides promising insights into prices’ current nature and movement, which are helpful for forecasts.
Thus, continue reading this article to learn how the pros exploit it for more informed trading decisions. You’ll understand its inner workings and why it can skyrocket your results today.
Table of Contents
1. How Does the MACD Work?
At some point, every top technical analyst has considered fitting MACD into their trading plan. It’s been around since the 1970s, courtesy of Gerald Appel. However, only a few bother to understand its mechanics nowadays.
The classic MACD works with two Exponential Moving Averages (of different periods) of the price data. Their subtraction creates a new MACD Line, usually shown on a separate graph below the price. The final Signal Line is a 9-period EMA of the resulting MACD Line plotted beside it.
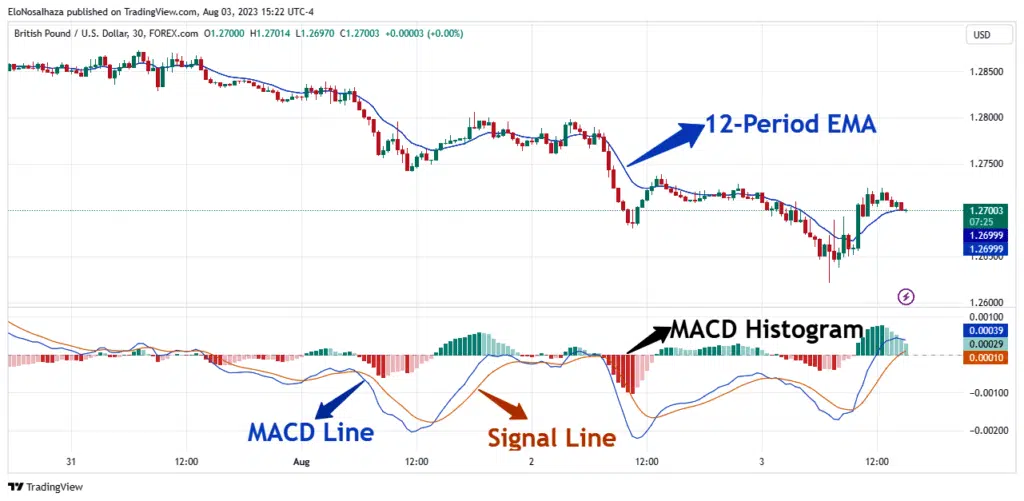
The MACD seems slightly more complex than regular indicators, like Fibonacci Retracement or RSI, but learning its nuts and bolts may change your perception.
1.1 Understanding the Components & Mathematics of the MACD
At first sight, the MACD may be confusing, overwhelming, and even intimidating. It’s one of those indicators that can completely change how you view charts over time.
The main reason beginners consider it complex is the many parts involved. Some components are on the price chart, while others display in a new pane, depending on your choice and the trading platform.
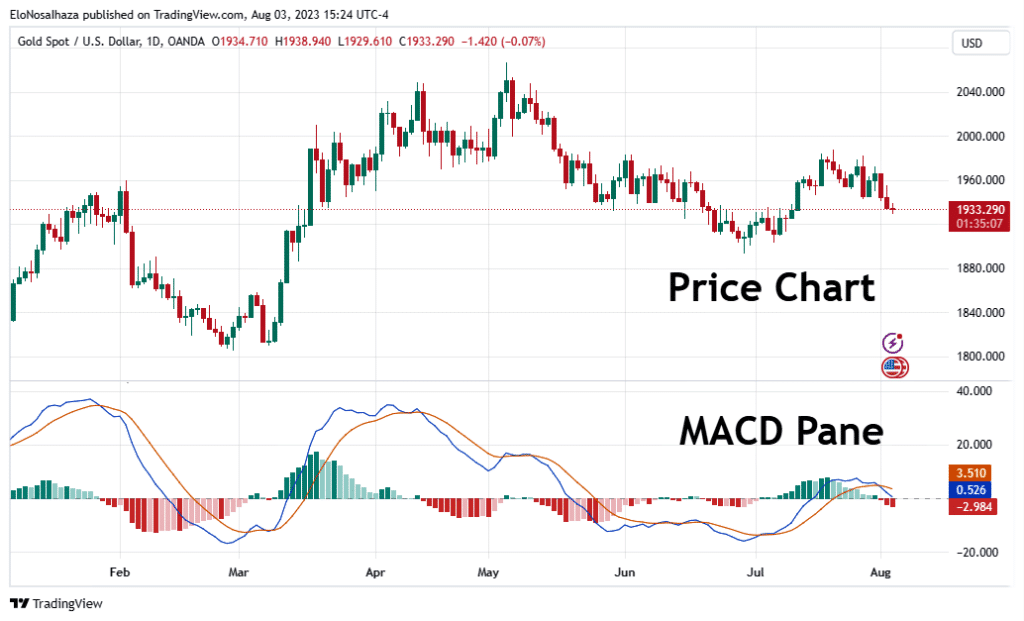
Regardless, the following features should be present in the classical version Appel developed:
1.1.1 Exponential Moving Averages
Classical MACDs comprise two Moving Averages, usually the 12-period and 26-period EMAs of the price data. Although they are the heart of the indicator (as every other component comes from them), some trading platforms omit them from the chart.
Like a regular moving average, you’ll understand the EMAs better on candlesticks or bar charts. However, you can be more creative with them.
1.1.2 MACD Line
The MACD Line represents the difference between the 12-period and the 26-period EMAs. Most trading platforms will show it in a new pane below the price chart.
MACD Line = EMA₁₂ – EMA₂₆
1.1.3 MACD Signal Line
The Signal Line is typically a 9-period EMA of the MACD Line. It is the final puzzle piece for trade entry and exit signals.
On many trading platforms, this component is with the MACD Line on its pane.
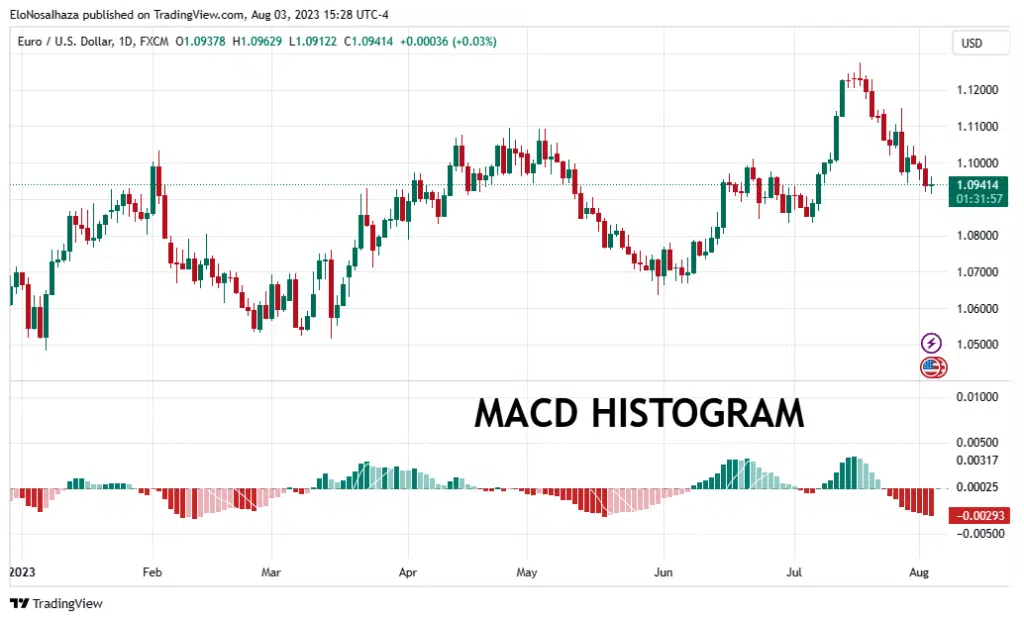
1.1.4 MACD Histogram
One of the least appreciated components of this indicator is the Histogram. It represents the difference between the Signal Line and MACD Line, which can increase the probability of your forecasts.
2. How Do You Use MACD Strategy?
The original purpose of MACD was to spot trends and assess their strengths. It gave traders the confidence to open positions in such auspicious conditions. However, the indicator has become even more insightful today.
A popular MACD strategy involves the cross of the MACD Line and the Signal Line. When the former crosses above the latter, some traders anticipate bullishness and vice-versa. Other pros also use the MACD line and the price movement for divergence theories, depending on their most recent behaviors.
Implementing these strategies is more challenging than it may sound, especially in real time. Fortunately, Indicator Vault has developed the Master MACD for TradingView to assist traders!
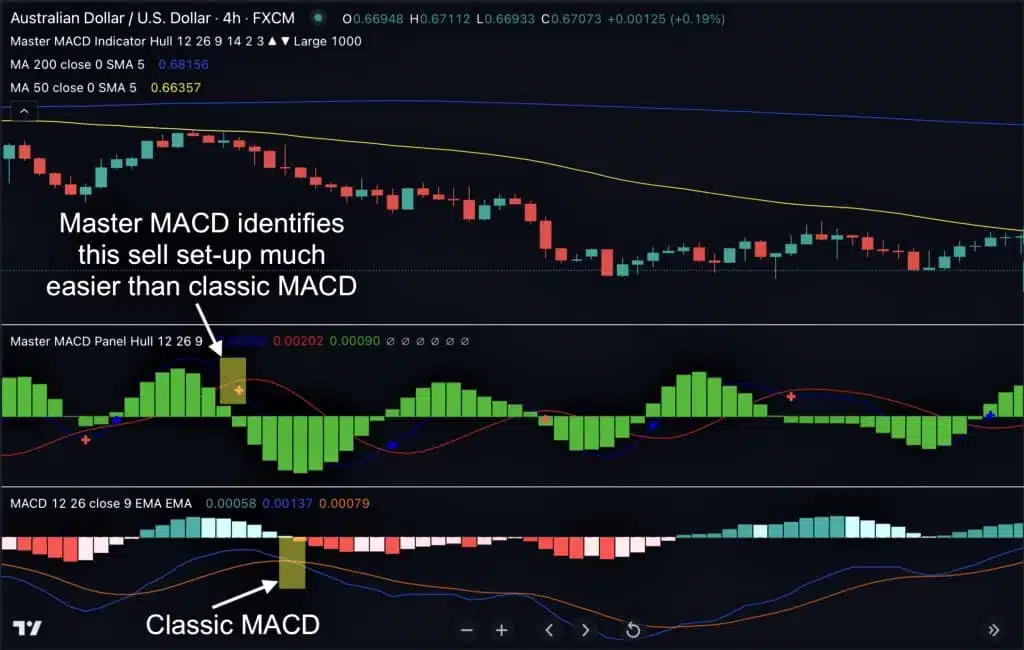
Here are some of the benefits and perks over the classical MACD indicator:
- Ability to open promising positions much more quickly due to Hull Moving Average’s fast market reaction
- Freedom to set whichever Moving Average type you desire
- Ease of customizing TradingView alerts and arrows to ensure you never miss massive opportunities
Moreover, Master MACD isn’t only programmed with its classical variant’s strategies. It excels at detecting potential price breakouts in any market and timeframe.
Too good to be true? Click here to check it out now, and you’ll be mind blown by how precise and profitable you can become today!
3. Bottom Line
The classic MACD indicator has established itself amongst the best and most reliable technical tools.
Its strategies usually involve the cross of the MACD Line either through the zero line or the Signal Line. Price analysts also pair it with the actual instrument’s price for divergence scenarios, which can be challenging.
However, you’ll only need to sit back and wait for high-probability signals with Indicator Vault’s Master MACD for TradingView. Explore it now by clicking here.
As there are several opportunities to enjoy these signals, share this article on social media, forums, and other websites to help more traders.
The comment section is also always open to opinions, questions, and results regarding the strategy.


